Over-engineering my homebrewing tank
I have a second hand Klarstein Maischfest 30L brewing tank that I use to brew beer. It is an ok, entry level, electric kettle with 2 x 1500W heating elements and an integrated temperature controller.
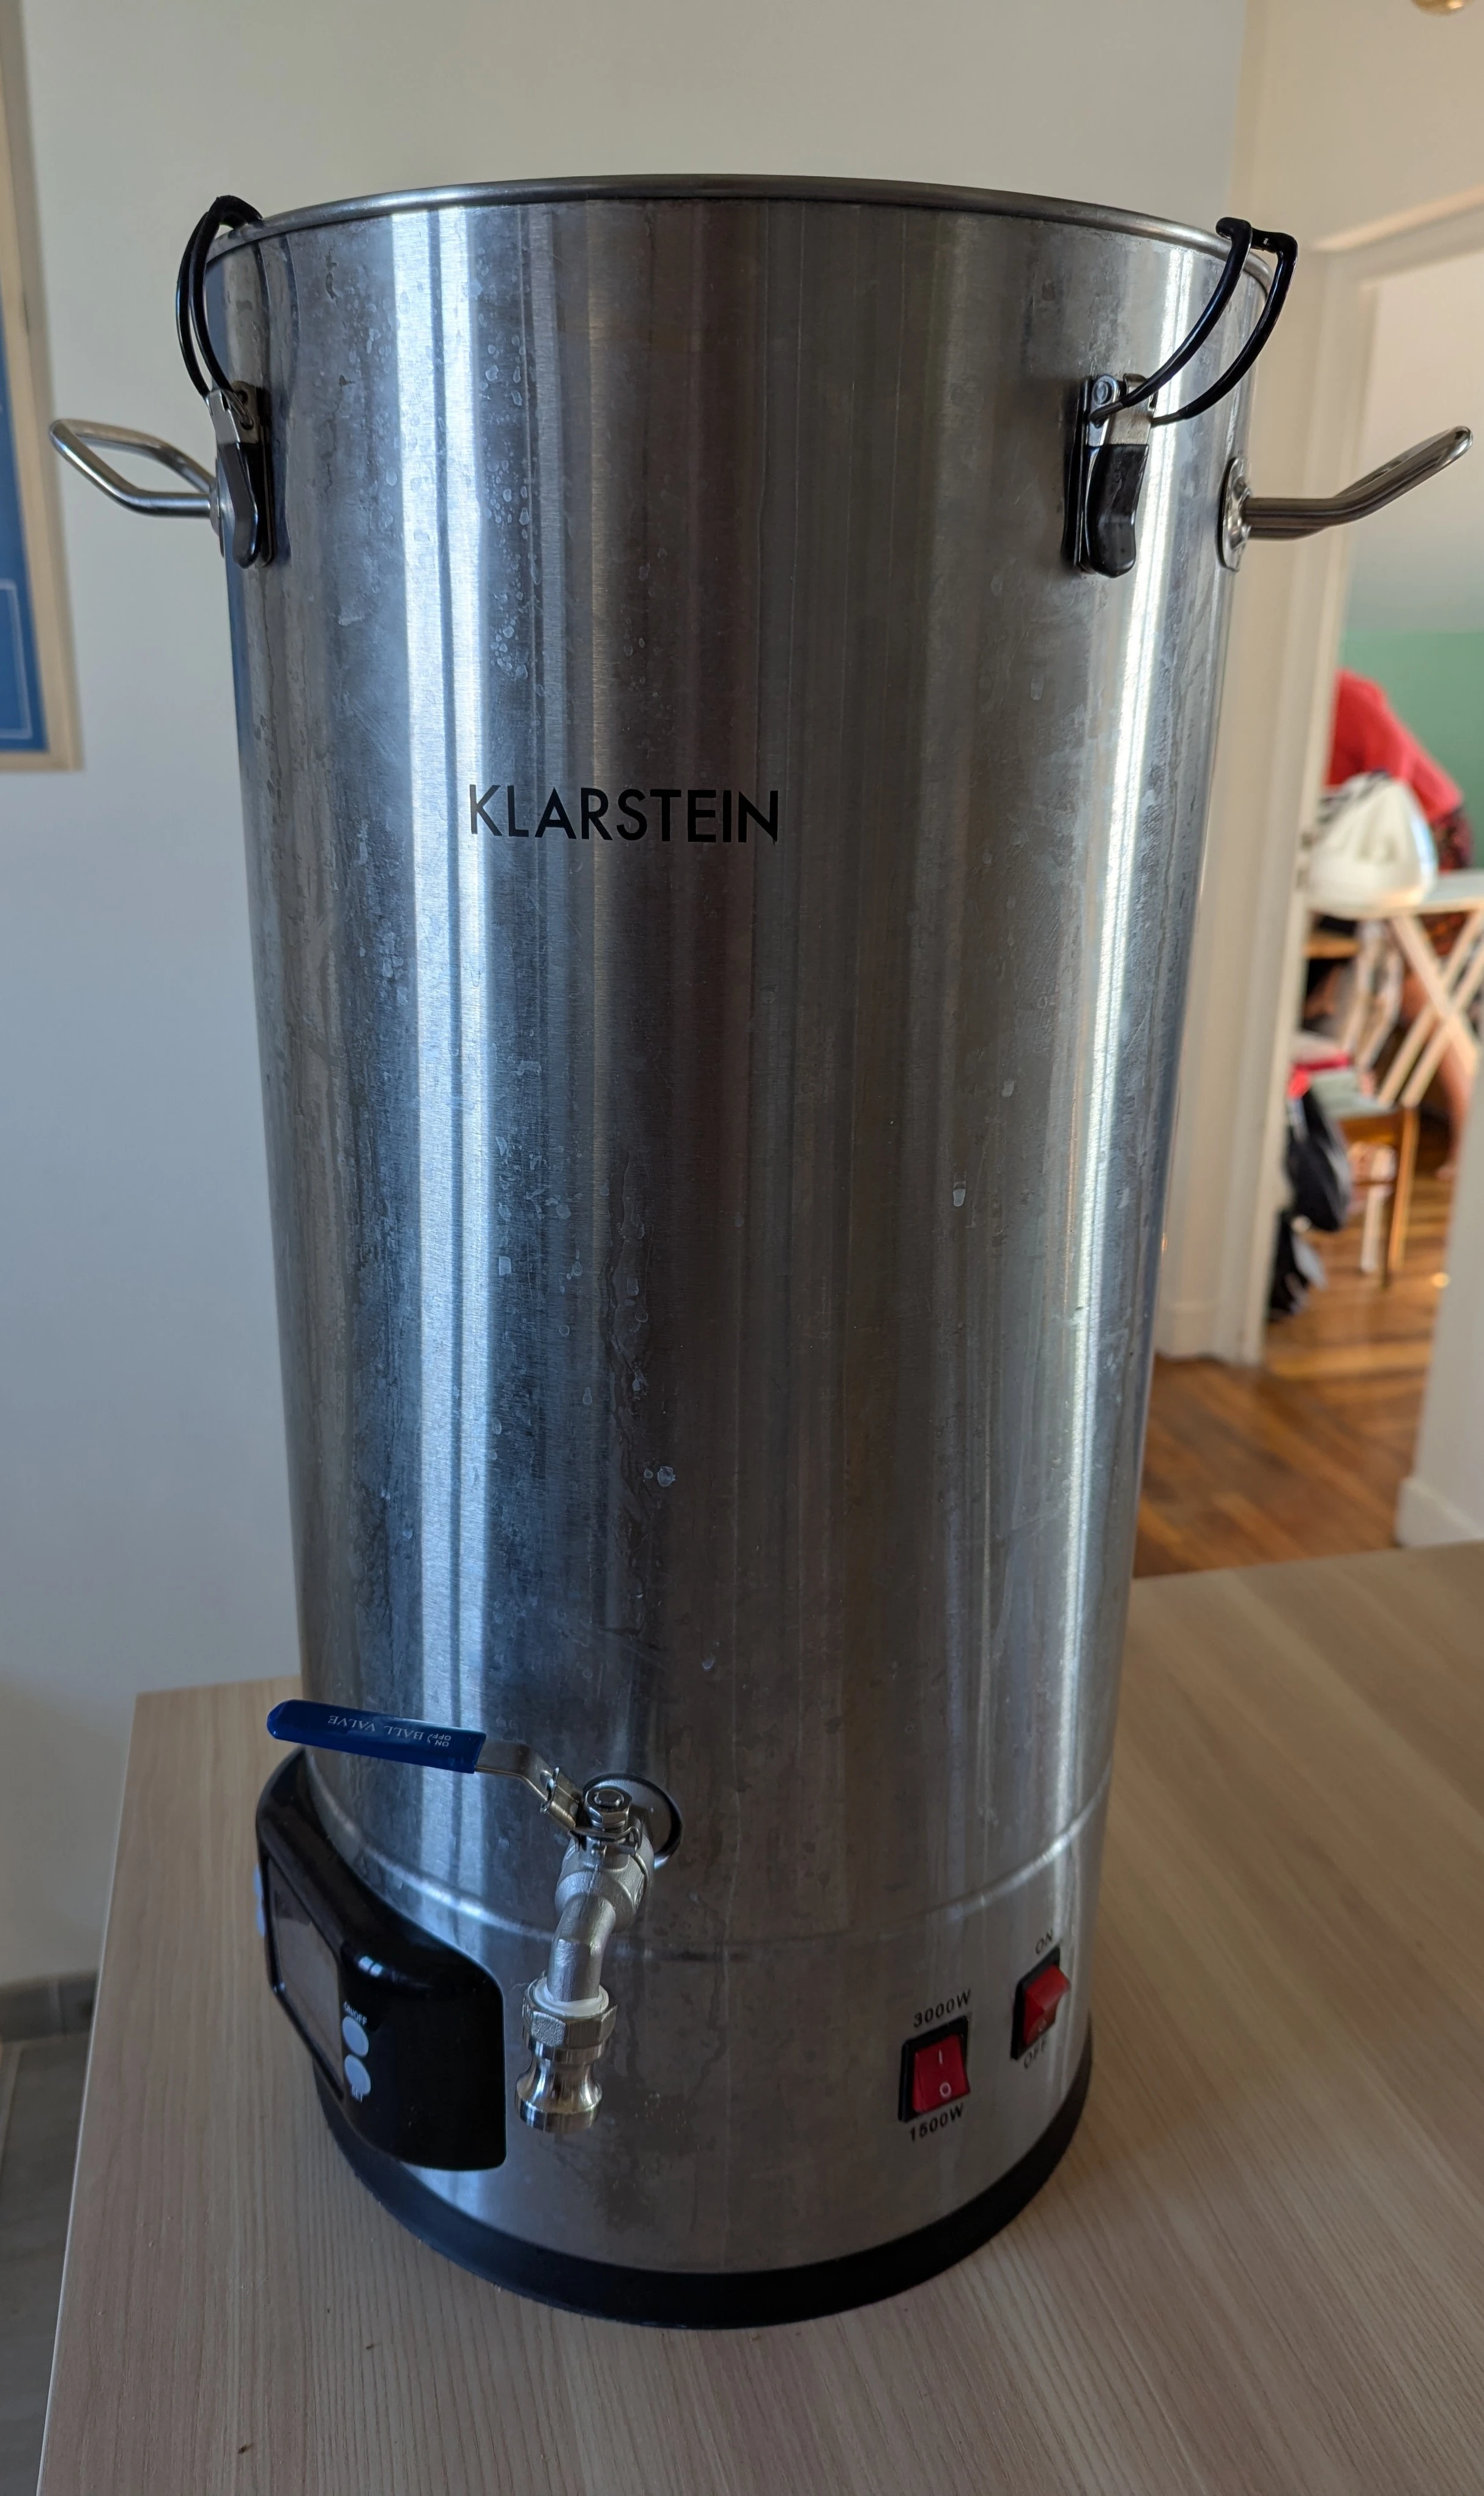
The kettle.
However, there is one issue with it, the temperature controller is bad. The way it is working is by turning on heating if temperature is below target minus 3°C, and turn it off when temperature is above target plus 3°C. This range of +/- 3°C is simply not acceptable for brewing beer. The first step, called the mashing, consist of putting malted grain in water at specific temperatures to make some magic happen with grain sugar. Usually you want +/- 1°C precision for the chemistry to do its work effectively.
Add to this issue, the fact that the thermometer probe gives the temperature the water was 1 minute ago, and you get a messy roller coaster instead of a constant temp.
So, until recently, I was a human temp controller. Basically, I sat in front of the vessel during the mashing process, and measured the temperature manually with an external thermometer every 10 minutes. When the temperature was under the target, I turned the kettle on with a fake higher target so it was triggering the heating elements, then stopped it after 20s or so, and checked again.
It was way too much work, so I decided to spend several days and too much money working on a way to fix that issue.
The plan
I first opened the false bottom of the kettle to access the circuitry.
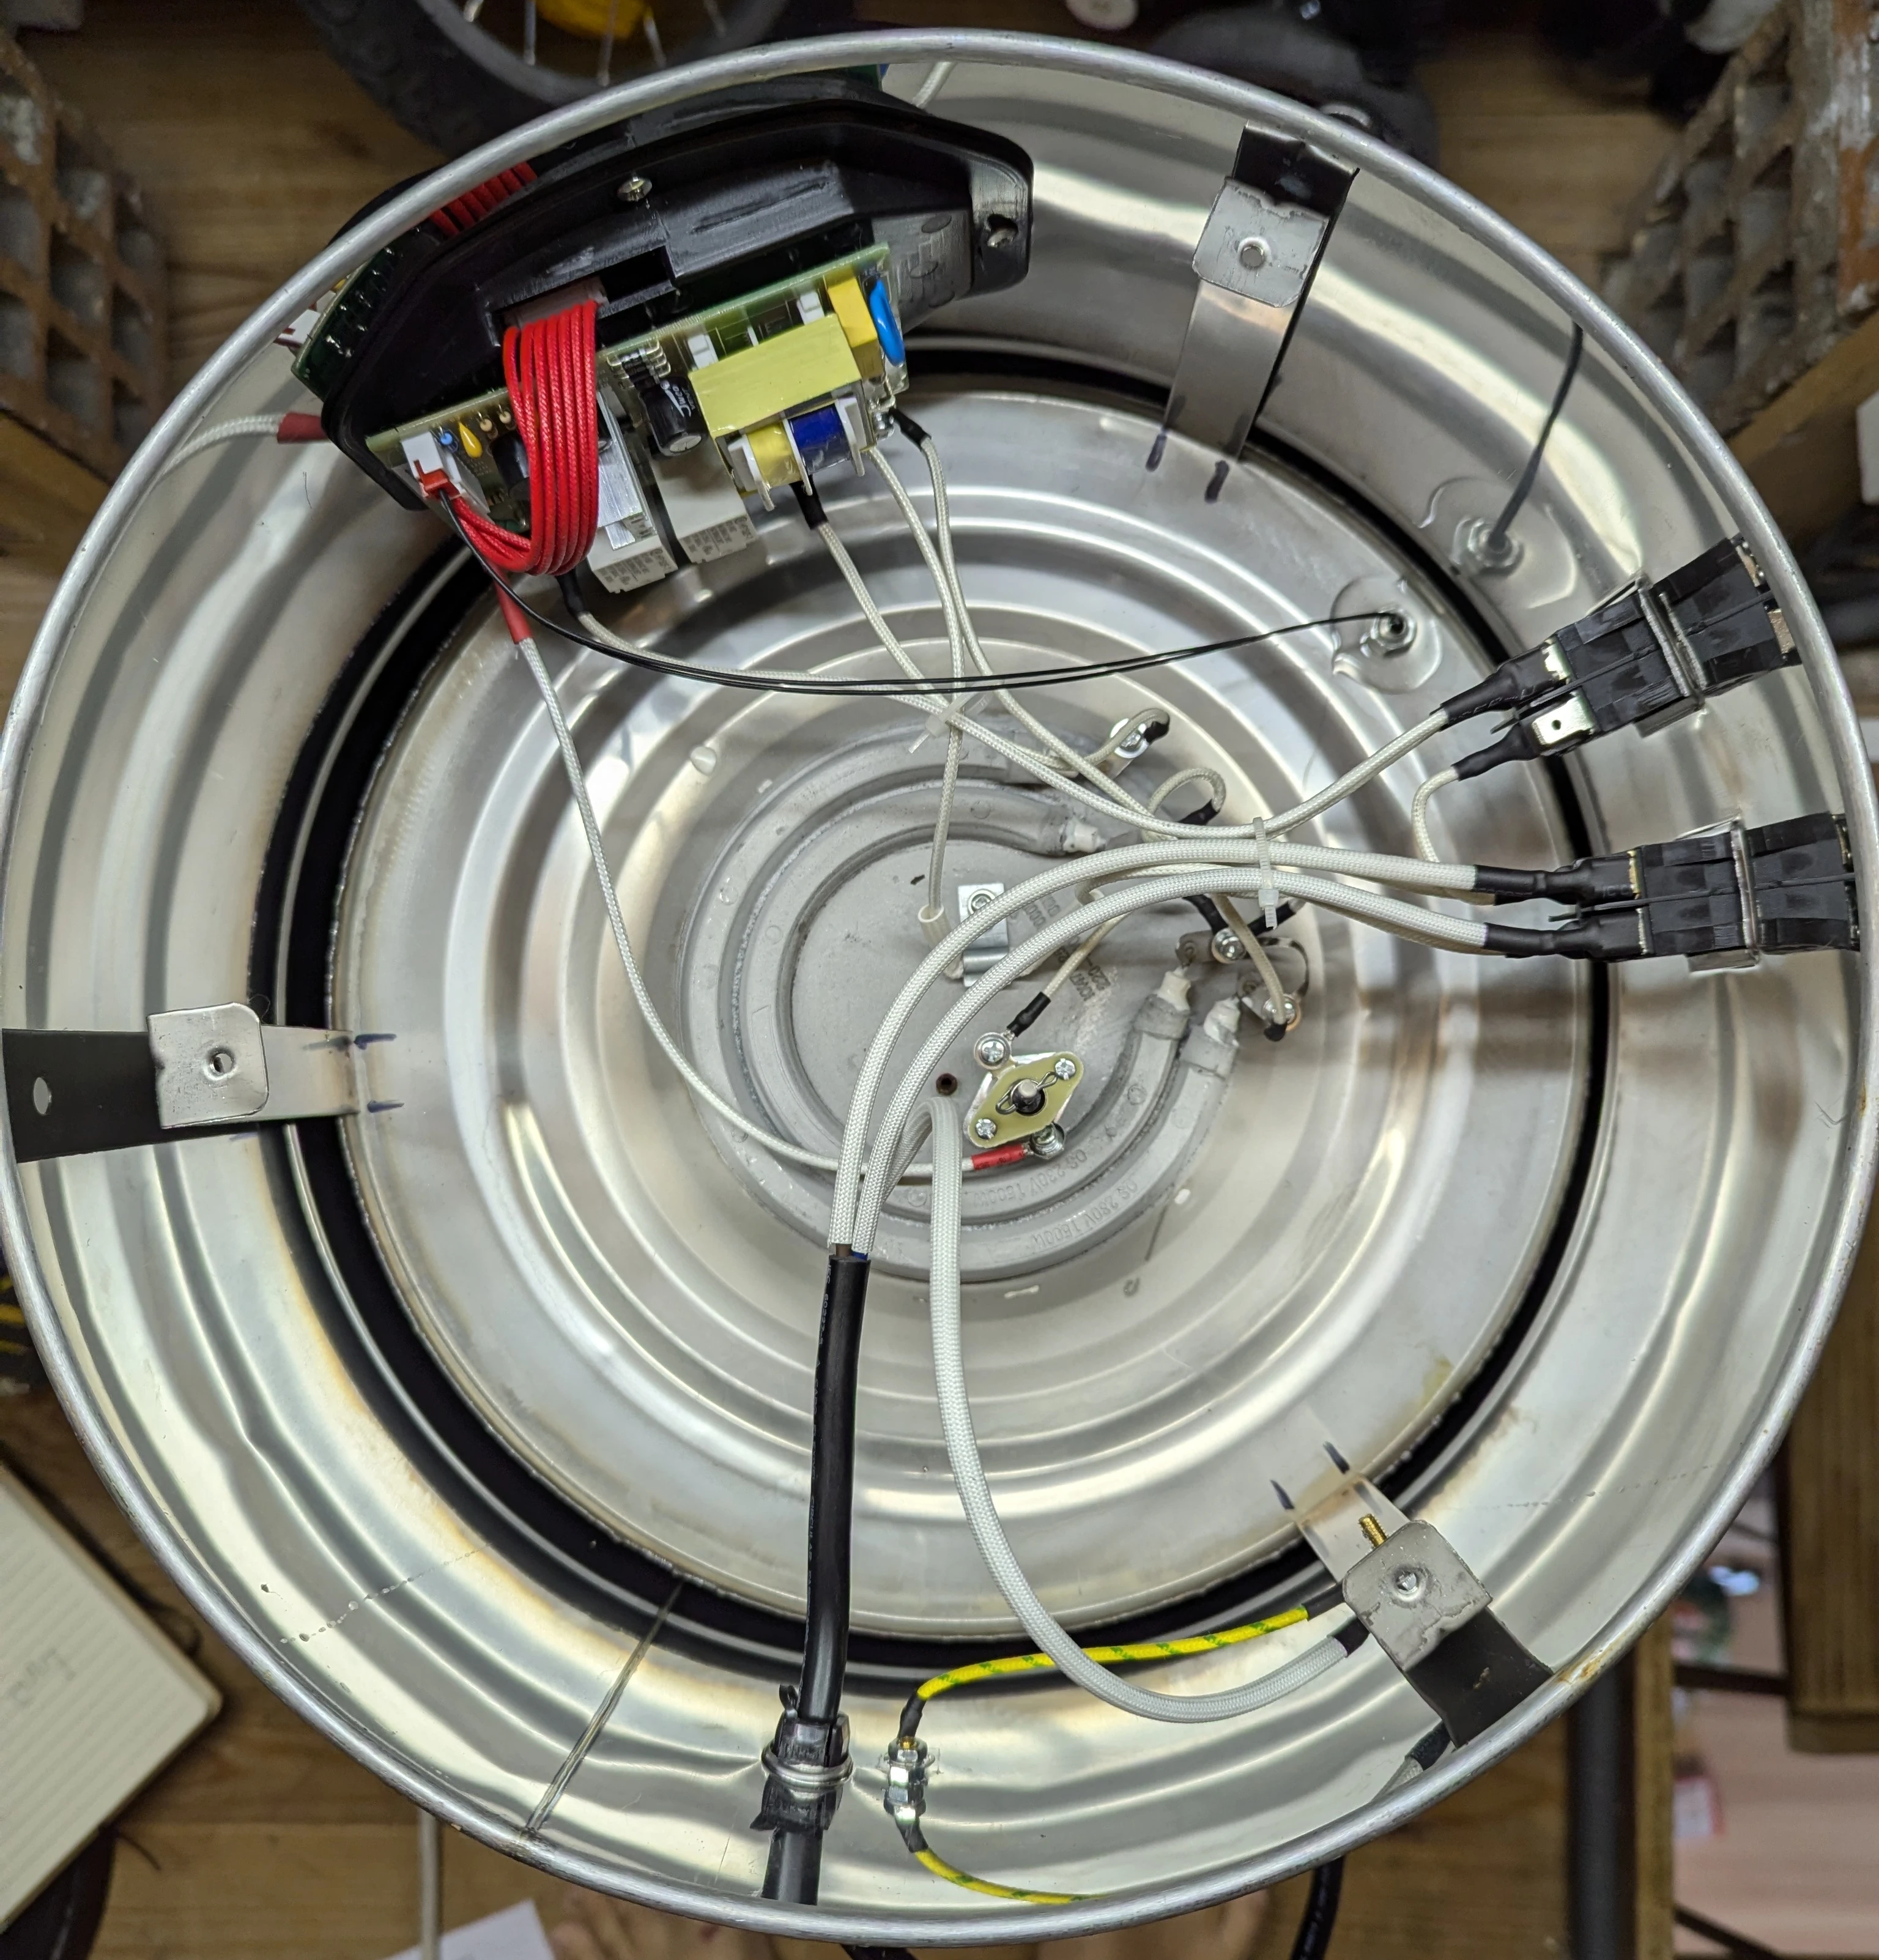
A view of the kettle internals.
There is two electric 1500W heating elements there, a thermal fuse, a thermal trip switch, and the ON/OFF switch.
Everything is connected to an exposed PCB containing the relays to control the heating elements, the power supply, and some misc components such as a buzzer.
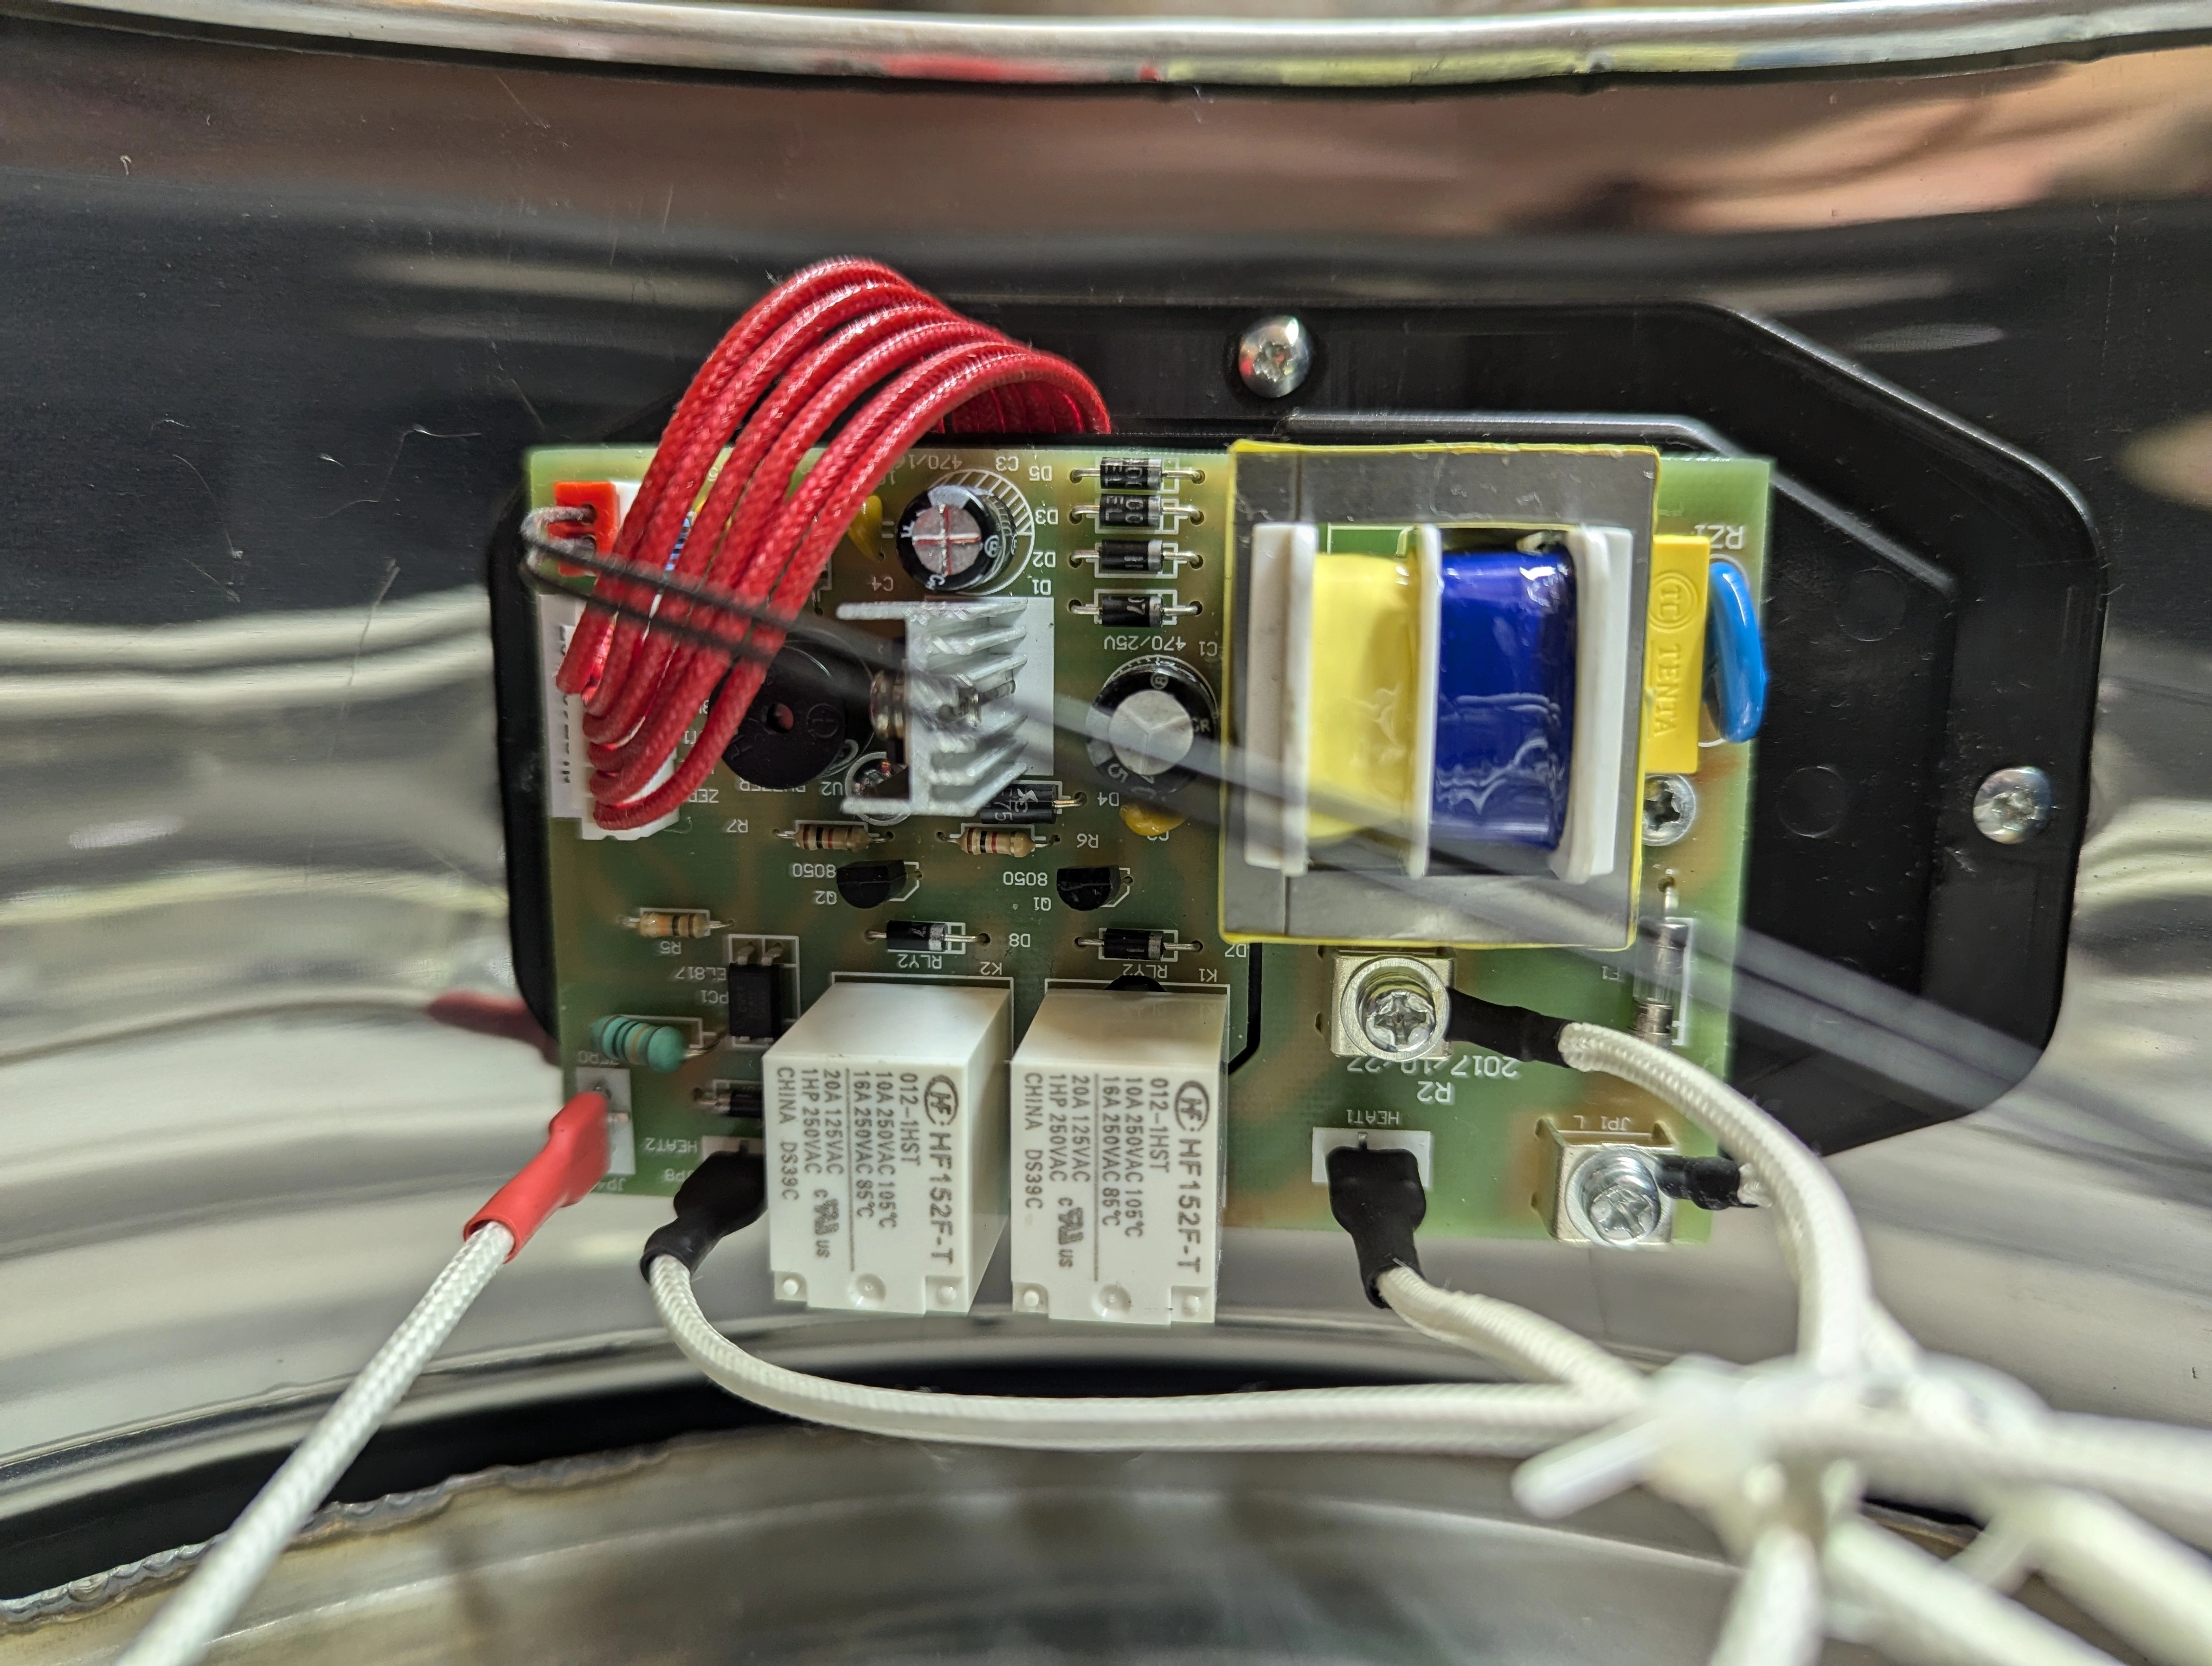
The PCB
You can see on this PCB that there is a connector with red cables going to an hidden PCB behind. The other PCB is not visible but it is holding the lcd screen, and probably the microcontroller for the logic. That is good news for me! That means that instead of bypassing everything by connecting to the heating elements direclty, I can only bypass the microcontroller. By connecting a new microcontroller to the connector on the exposed PCB, I can control the perfectly fine relays, and use the original power supply and thermometer probe. Moreover, it allows me to keep the safety features such as the thermo sensible switch at the bottom of the kettle.
I wanted to keep the original microcontroller available though, in case my new system would not work properly. My plan was to have a switch on the outside of the kettle to be able to select what controller to use. The switch would allow me to disconnect the original controller from the exposed relays PCB and connect the external new Arduino controller.
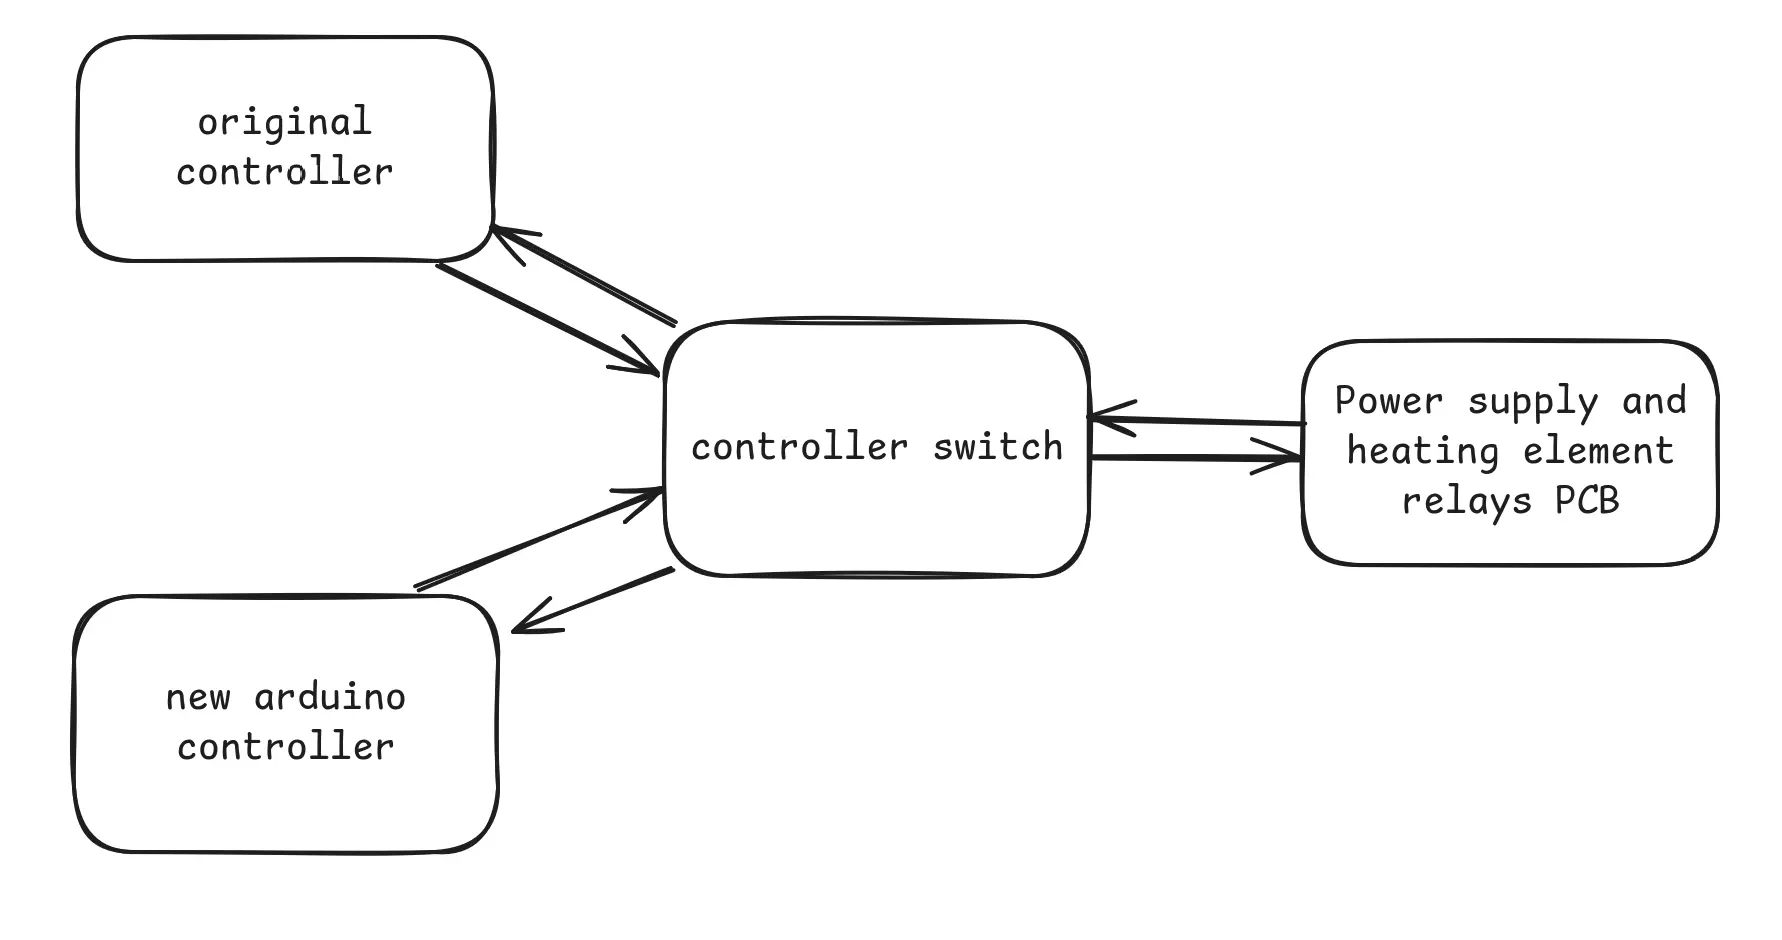
The plan.
Retroengineering the PCB.
Looking at the connector between the relays/power PCB and the microcontroller one, we can see the following pins: VCC5, GND, NTC, BUZ, HT1, HT2, ZERO. By unplugging the microcontroller PCB, and plugging prototyping wires to the pins, I managed to confirm my understanding of those pins by testing it with a multimeter and a breadboard.
There is 4 input pins (from the relays/power PCB to the microcontroller PCB):
- GND: ground.
- VCC5: 5v supply for the micro controller.
- NTC: Negative Temperature Coefficient, the temperature data. I will need to find a way to get degres from the voltage. More on this below.
- Zero: The thermo sensitive safety switch. This pins reads ~3V when switch is not triggered, and ~5V if switch is opened after it overheats.1
There is 3 ouptut pins:
- HT1: The relay trigger for the 1st heating element. Putting 5V to it turns the heating element 1 ON.
- HT2: The relay trigger for the 2nd heating element. Putting 5V to it turns the heating element 2 ON.
- BUZ: the buzzer control.
Kettle modification
Let’s start by modifying the kettle, so I can plug an Arduino to it. My plan is to have the new temp controller working outside the kettle, by being plugged through a 7 pin connector going through the false bottom wall.
Developping and testing the controller will be easier this way, and this makes my design actually modular. If I want to upgrade or fix the new controller later, I can unplug it and put a new one on the connector.
I bought some thermally protected wire for this as the heating elements are very close to all the wires inside the false bottom.
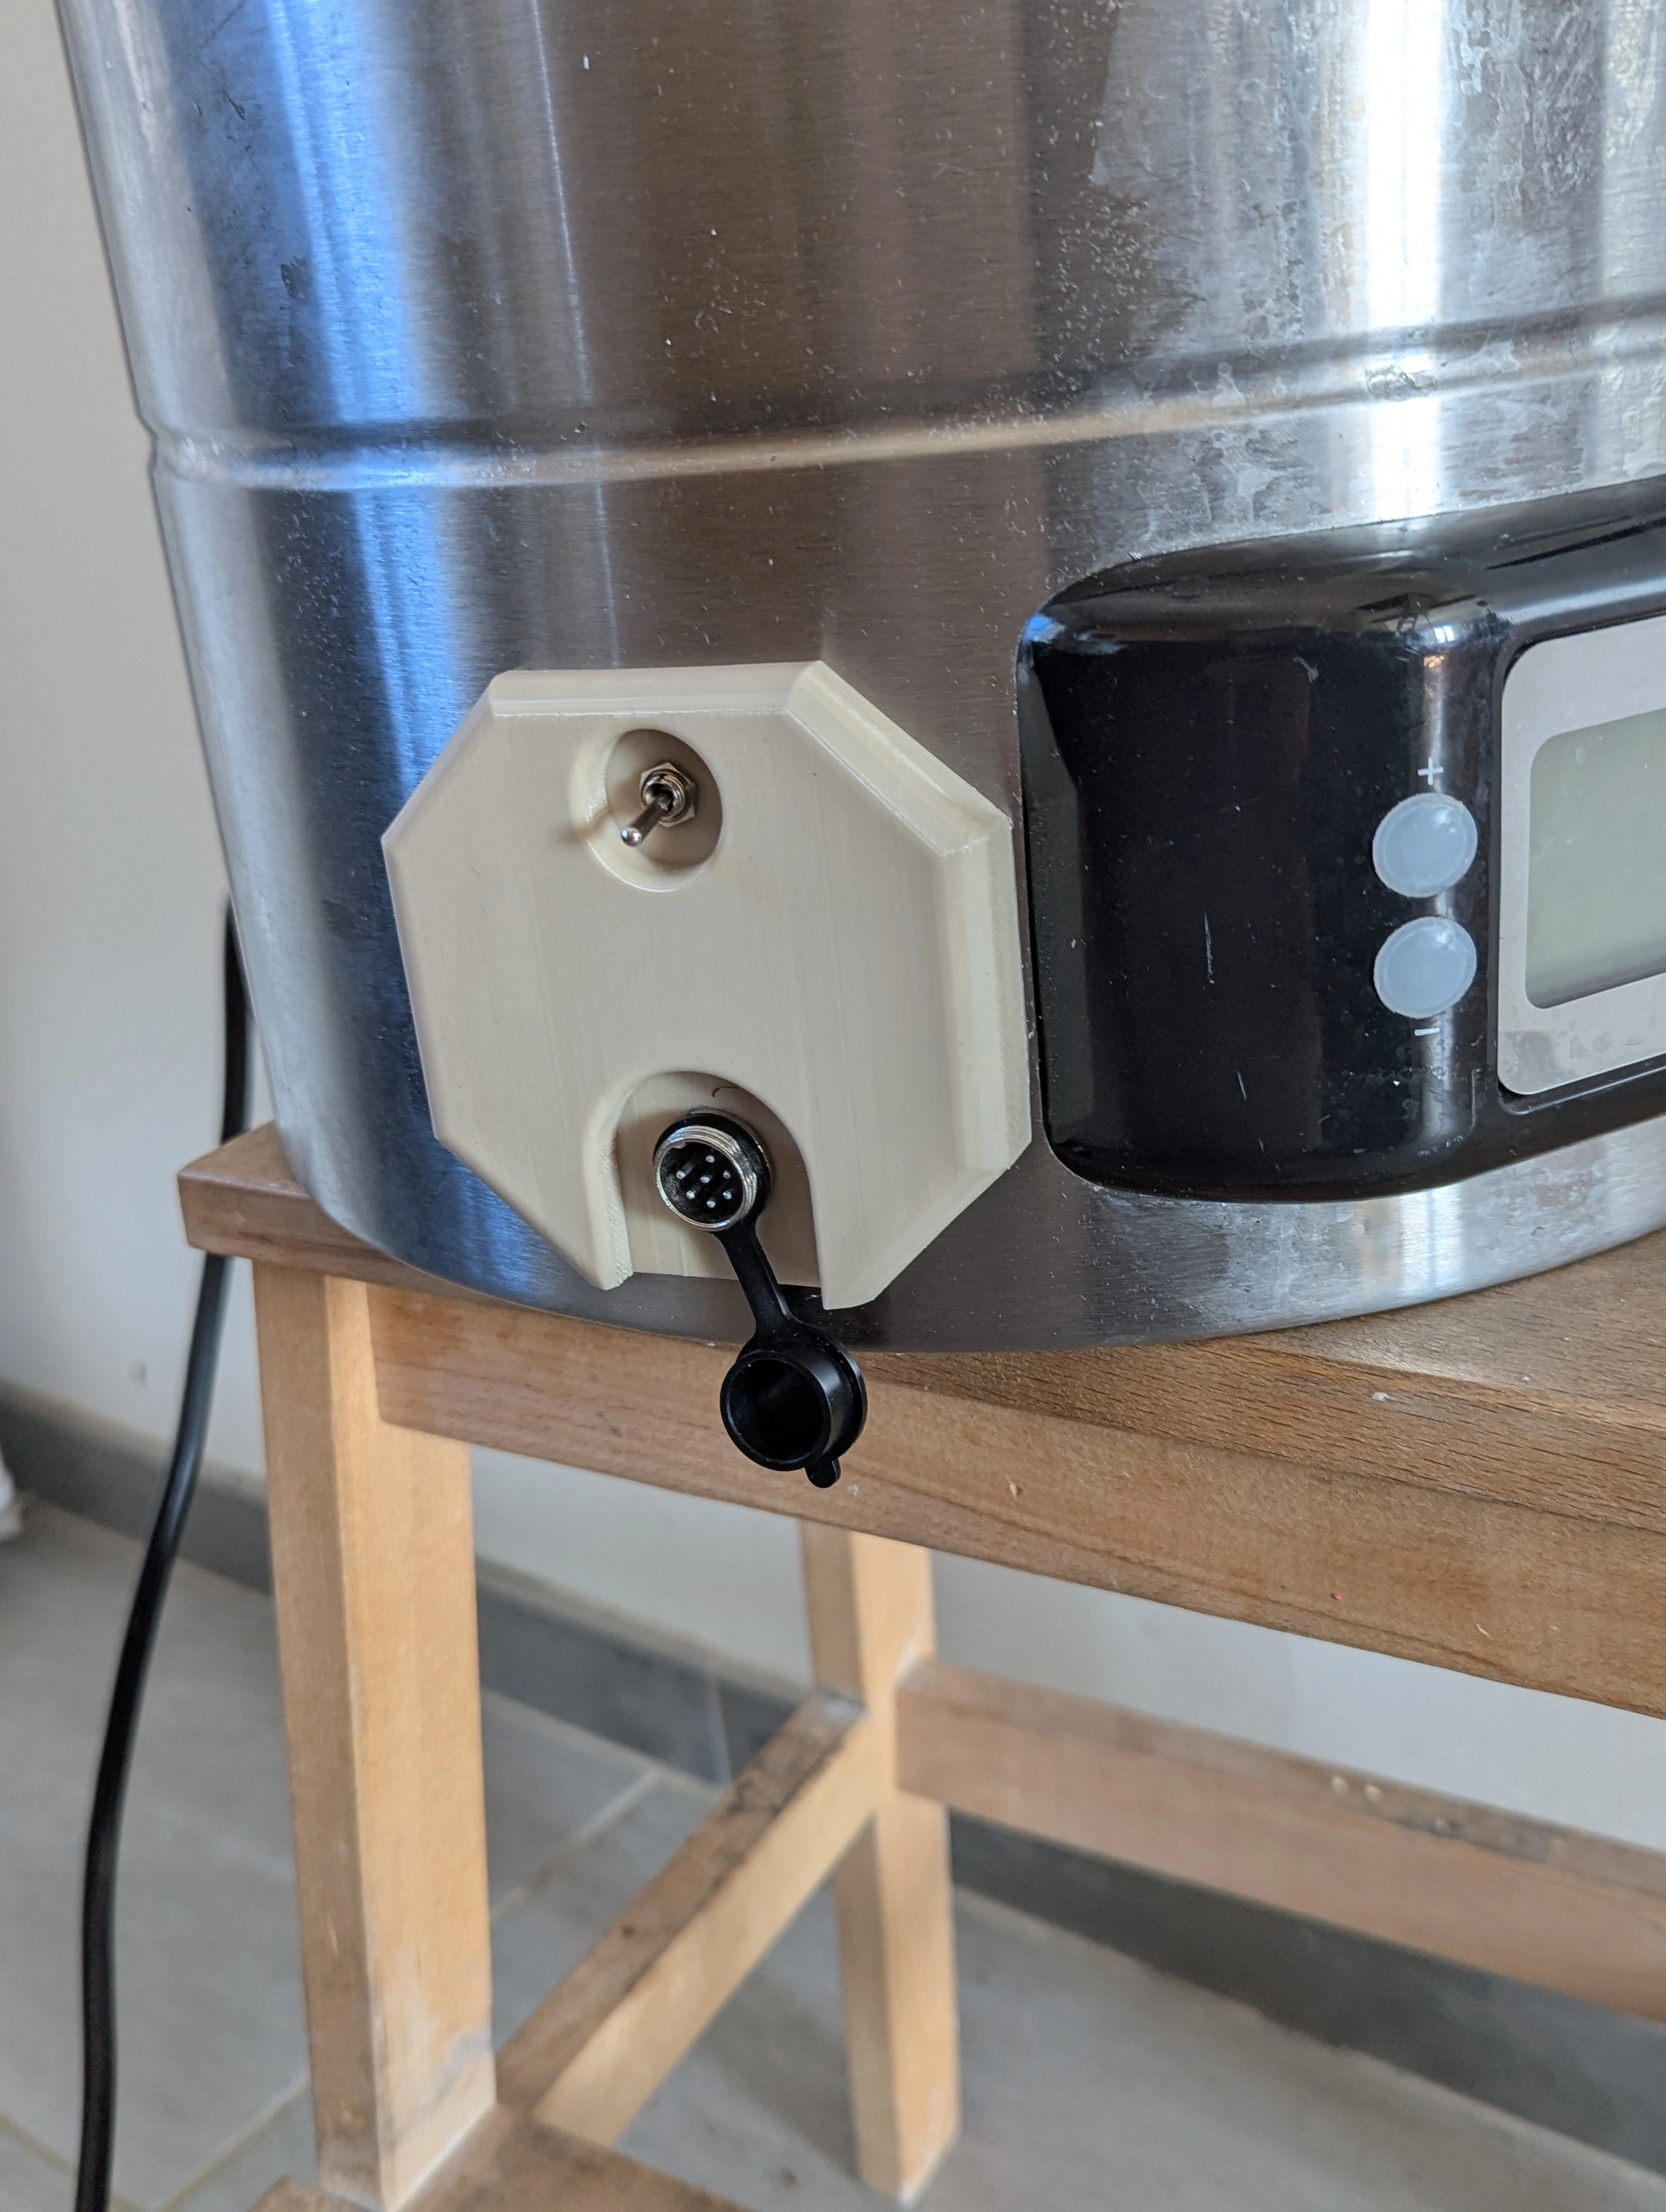
Because the wall is curved, it is kind of tricky to attach a new PCB. There is no place to do so cleanly. I decided to 3D print a curved support that would fit the wall nicely, and serve as a protection for the connector and the switch on the outside wall (water or sugary liquid can be easily spilled on the outside while cleaning or brewing, and I like the idea of protecting a little bit the electrical part from it). Hopefully, the plastic part is not heated to much, and far enough from the heating elements. Finger crossed.
Here are pictures of the finished modification:
The « controller switch » PCB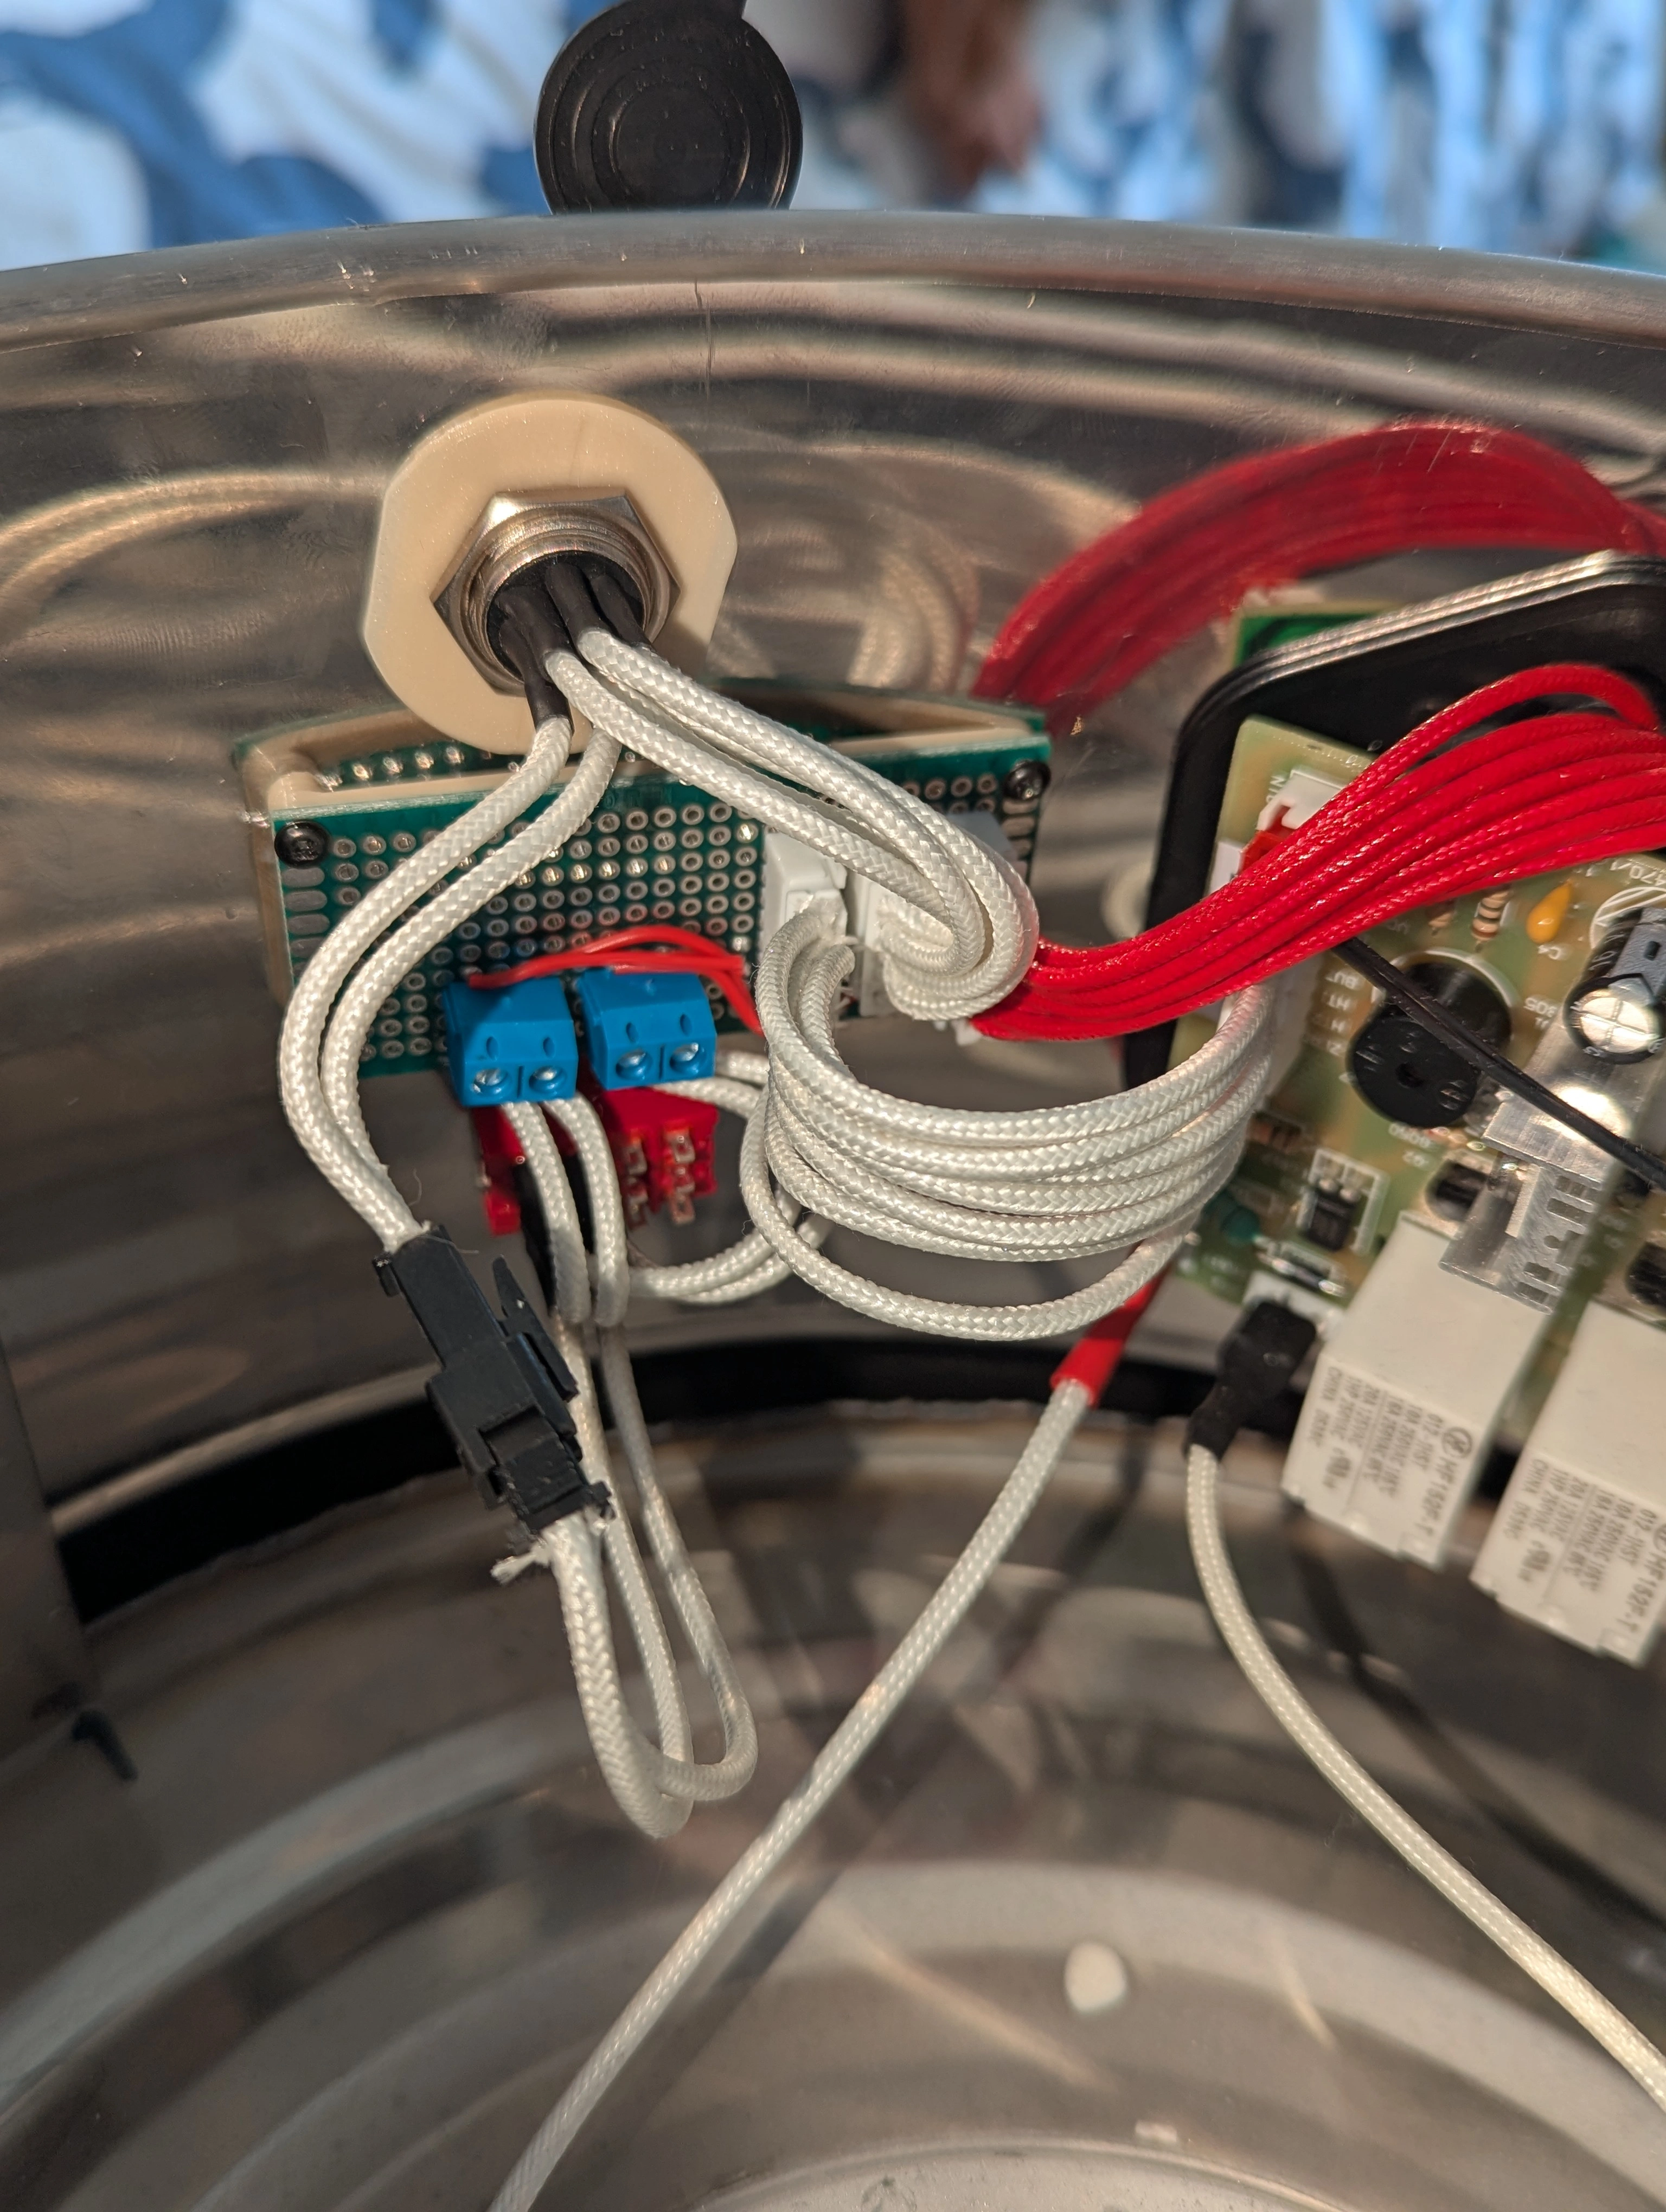
“-Good coloring! -That’s bone.”
NTC voltage to temp and heating behavior of the kettle
NTC theory
In order to control the water temperature accurately, I needed to have a relation between the voltage read on the NTC pins and the actual probe temperature. NTC probes work by varying the resistance of the probe according to the temperature. The resistance decrease as the temperature rises. The detailed math is described in the thermistor Wikipedia article, but basically, the resistance / temperature coefficient, is described best by the Steinhart–Hart equation: \[\frac{1}{T} = A + B \ln{R_{ntc}} + C(\ln{R_{ntc}})^3\]
But we have the NTC pin voltage and not the NTC resistance. Looking at the PCB in detail, here is the portion of the board bringing the NTC resistance information to the NTC pin:
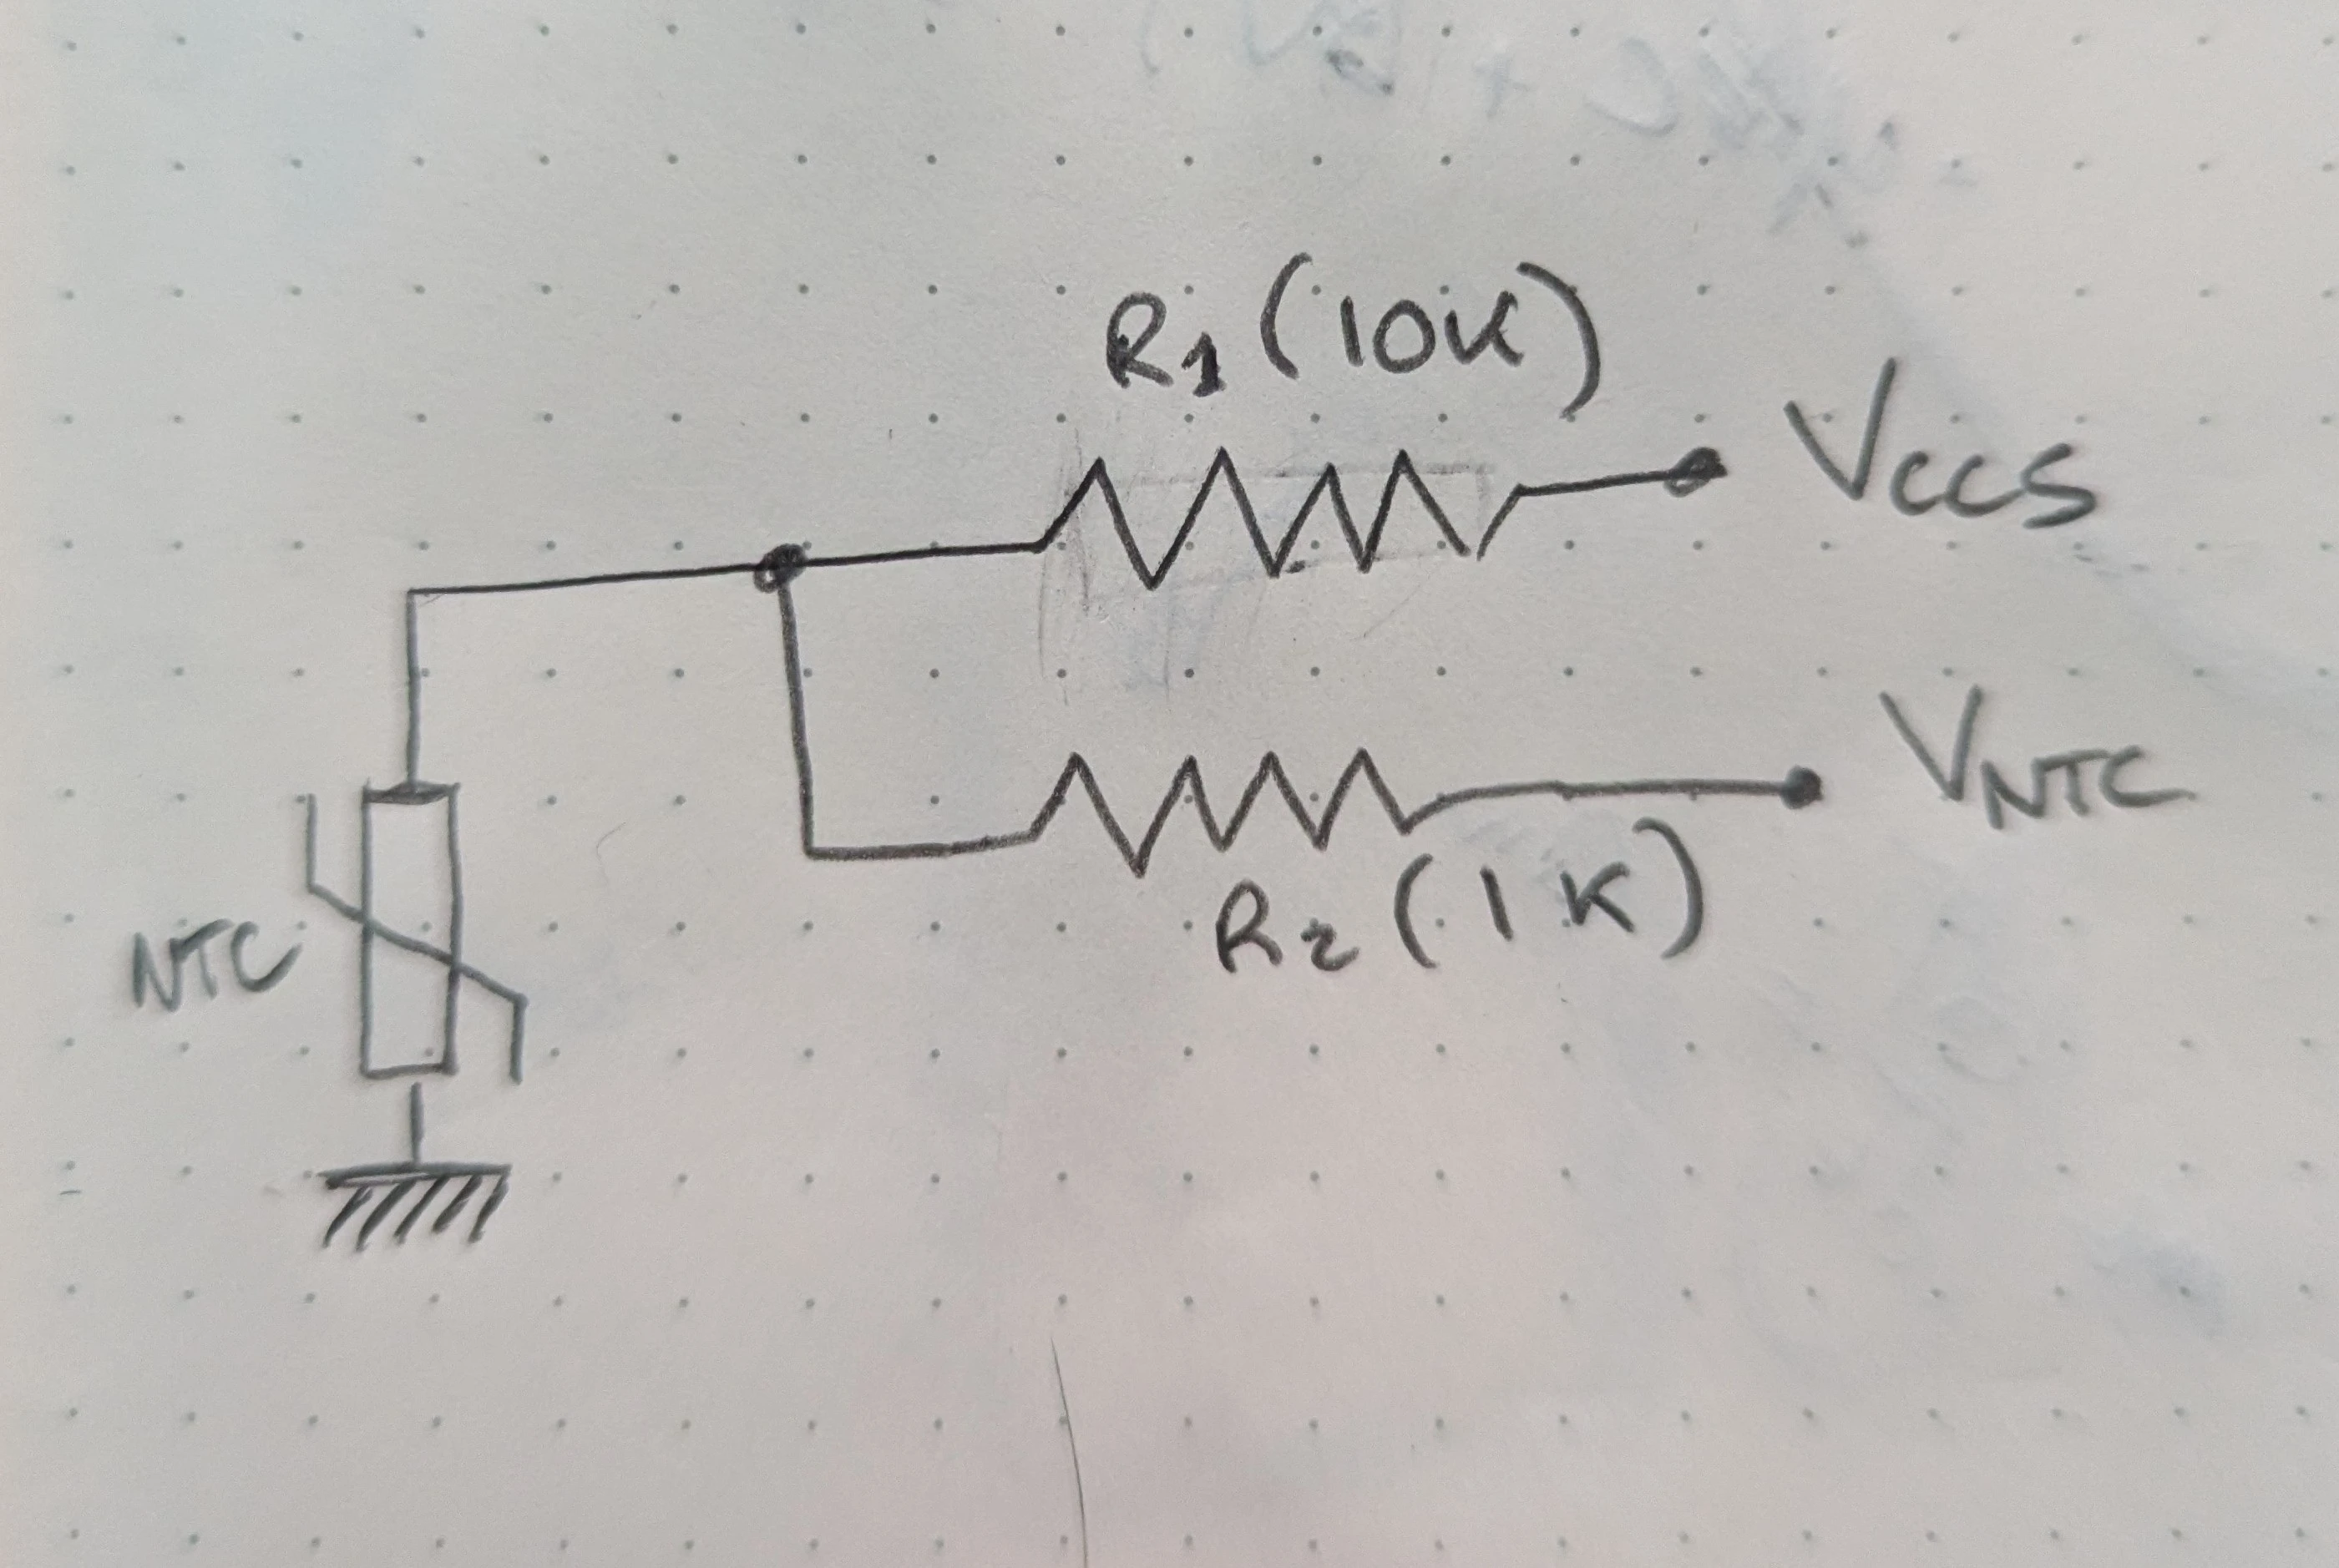
Schematics of the NTC pin
This gives the following relation using the voltage divider formulae: \[V_{cc5} \frac{R_{ntc}}{R_{ntc} + R_2} = V_{ntc} \frac{R_{ntc}}{R_{ntc} + R_1}\]
On the arduino though, when connecting the \(V_{ntc}\) voltage to an analog reading pin, I will get the reading \(1024 \frac{V_{ntc}}{V_{in}}\). As I plan to connect the \(V_{cc5}\) voltage to the \(V_{in}\) pin, I have the relation betwen the voltages and the reading of the analog pin P: \[ P = 1024 \frac{V_{ntc}}{V_{cc5}} \]
This gives me the final relation between the NTC resistance and the analog pin reading: \[ R_{ntc} = \frac{\frac{P}{1024}R_1 - R_2}{1 - \frac{P}{1024}}\]
Replacing the NTC resistance in the Steinhart-Hart equation we have: \[\frac{1}{T} = A + B \ln{(\frac{\frac{P}{1024}R_1 - R_2}{1 - \frac{P}{1024}})} + C(\ln{(\frac{\frac{P}{1024}R_1 - R_2}{1 - \frac{P}{1024}})})^3\]
We need to find A, B and C. To retrieve those unknown parameters, we have to make some actual temperature and voltage measurement accross the range of usual temperatures and just perform a curve fitting.
Temperature of the water inside the kettle
I was also planning of using those temperature measurement to learn more about my kettle behavior in term of heat loss and heating power. I was hoping to use those values in the controller to better control the temperature, and I was curious about the actual numbers.
The main goal was to get 3 values:
- time needed to heat the volume of water 1°C, in function of the volume and the temperature.
- temperature lost during a specific amount of time with no heating, in function of the volume and temperature.
- probe lag: the actual time it takes the temperature probe to reach the actual temperature in the tank.
With thoses values, I would be able to make the temperature controller.
Using some basic thermodynamic we have the following formulae for the variation of heat in the kettle: \[\frac{dQ}{dt} = Q_{in} - Q_{loss}\]
The total heat energy of the water is given by: \[Q = mcT\] with \(m\) the mass of water, \(c\) the specific heat capacity of the liquid (\(4186 J.kg^{-1}.K^{-1}\) for water2) and \(T\) the temperature.
I first planned to perform curve fitting using a simple model taking into account only convection loss in the \(Q_{loss}\) parameter.
\[Q_{loss} = \frac{UA}{mc} (T - T_{ambient})\]
With A the area of the volume of water and U a heat loss coefficent.
The issue is that my tank is open on the top and the evaporation of water is really not a negligible heat loss. Math at this point became to much for me as evaporation depends on a lot of factors, as well as the actual water temperature in a non-linear way. I am not even sure the differential equation is solvable? This website is only giving experimental(?) charts.
I figured I only needed a good approximation around a limited temperature range as the brewing mash process is always taking place between 50 and 80°C. So, I went ahead with the actual measurements to see the curve shape and know if I could make good linear or polynomial reductions, or simply use the experimental plots to get the values without having any model behind.
Temperatures measurements
I performed the following tests:
- Heat a known volume of water to 100°C, knowing the ambiant temperature, and every few seconds, taking the timestamp, the ntc voltage reading, the temperature given by the old controller (read on the probe), and the temperature given by an external thermometer.
- Continuing the measurements, cut the heat and let the water cool down.
Here are the plots:
Temperature of water during heating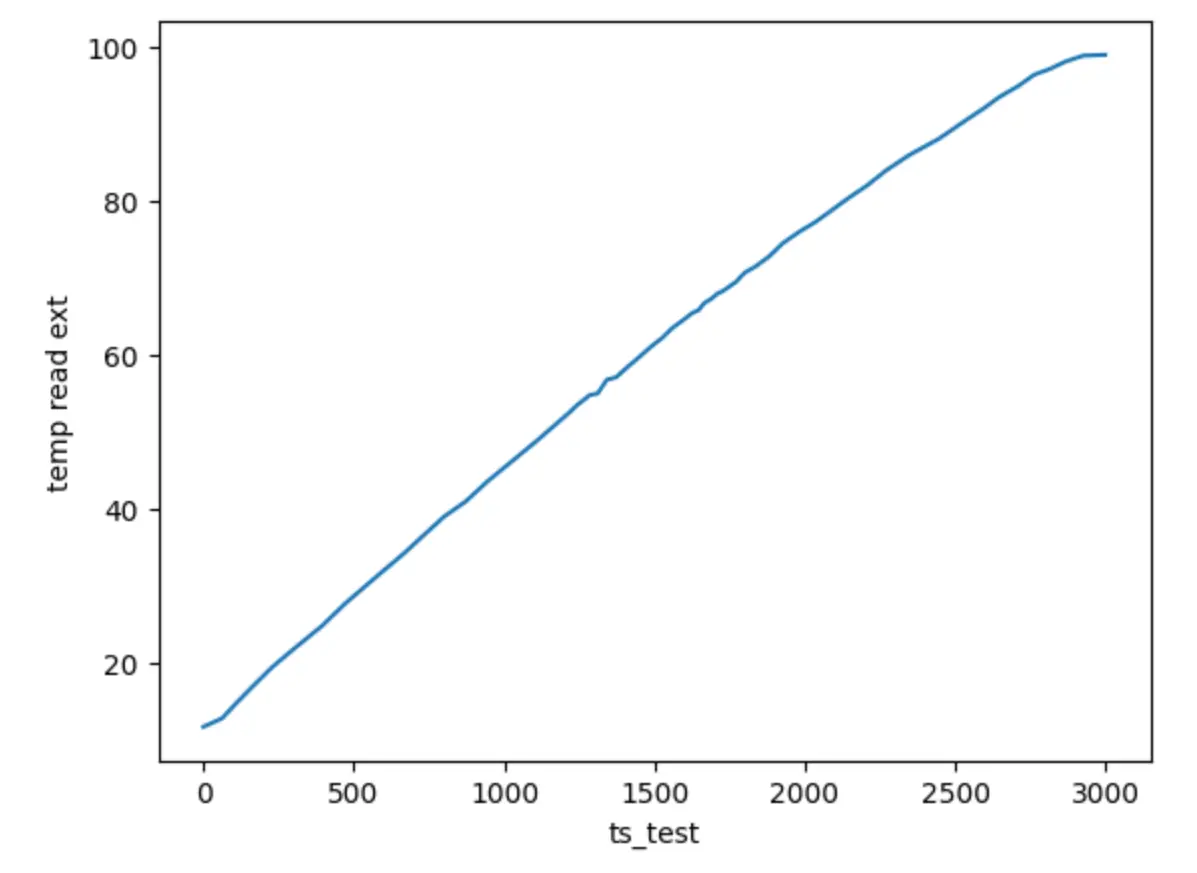
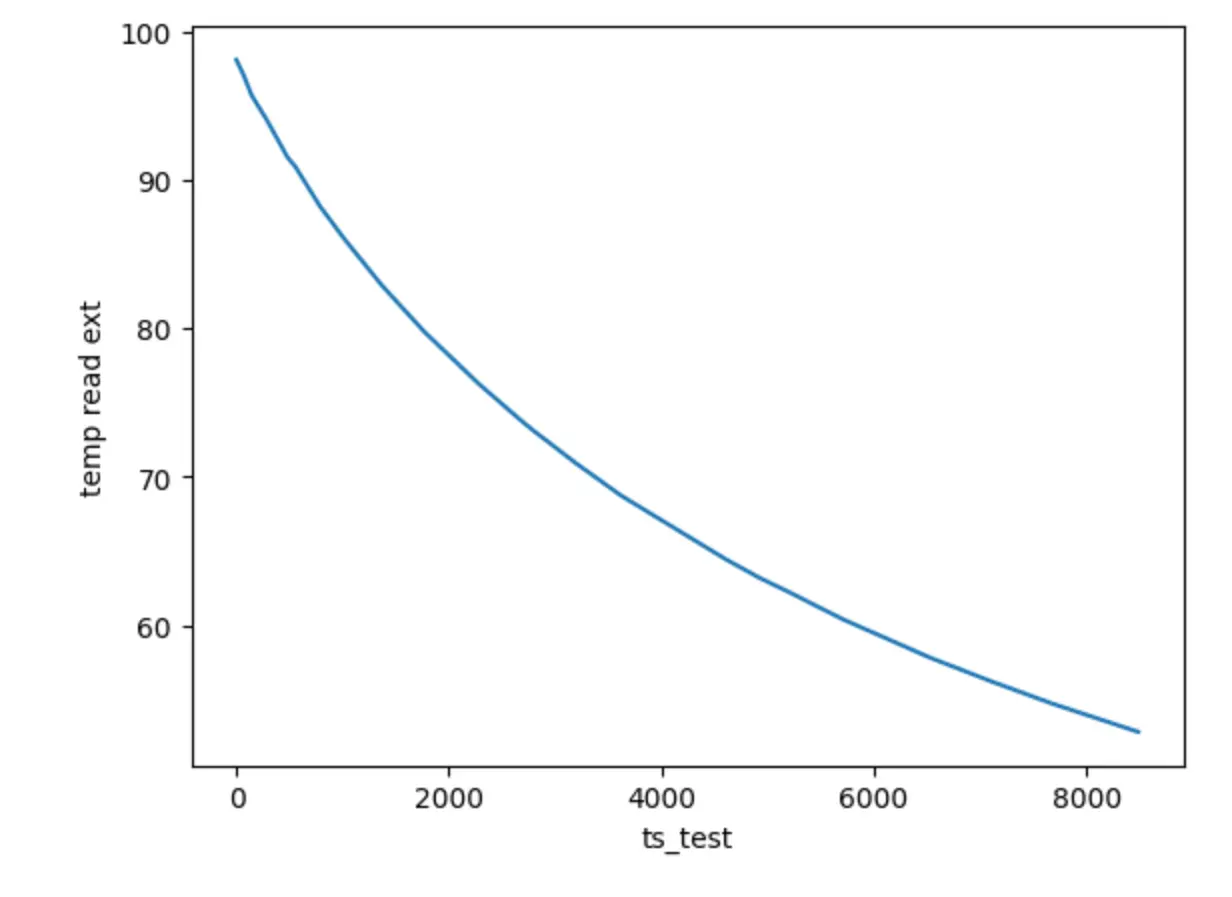
Temperature of water during cooling
All those data points gave me a nice scatter graph of the NTC voltage compared to the temperature of the water. You can see the really nice curve fitting of the Steinhart–Hart equation in red.
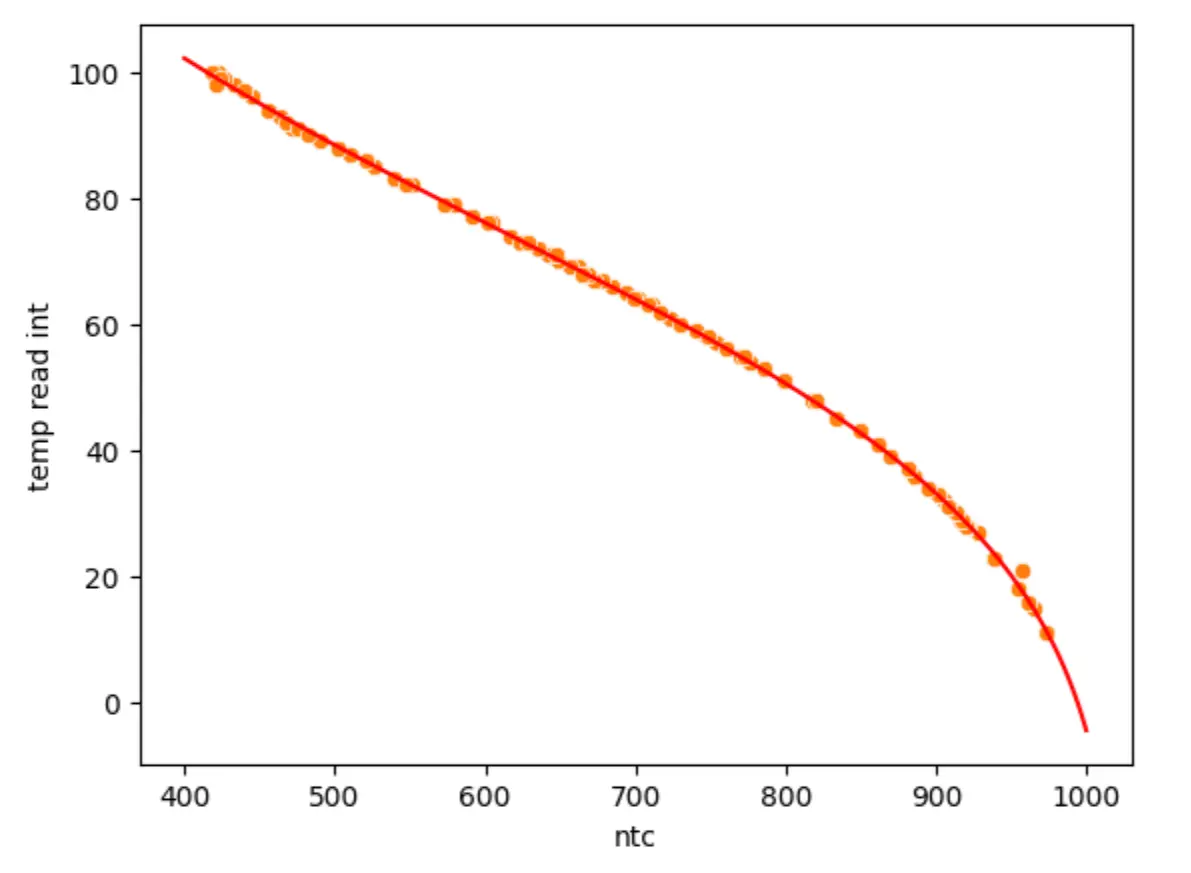
NTC voltage over water temperature scatter plot, with the curve fitting done.
I also looked at the graphs around the typical mashing temperature. During heating phase, we can simply do a linear regression:
linear regression of the heating test temperature around the typical mash temperatures.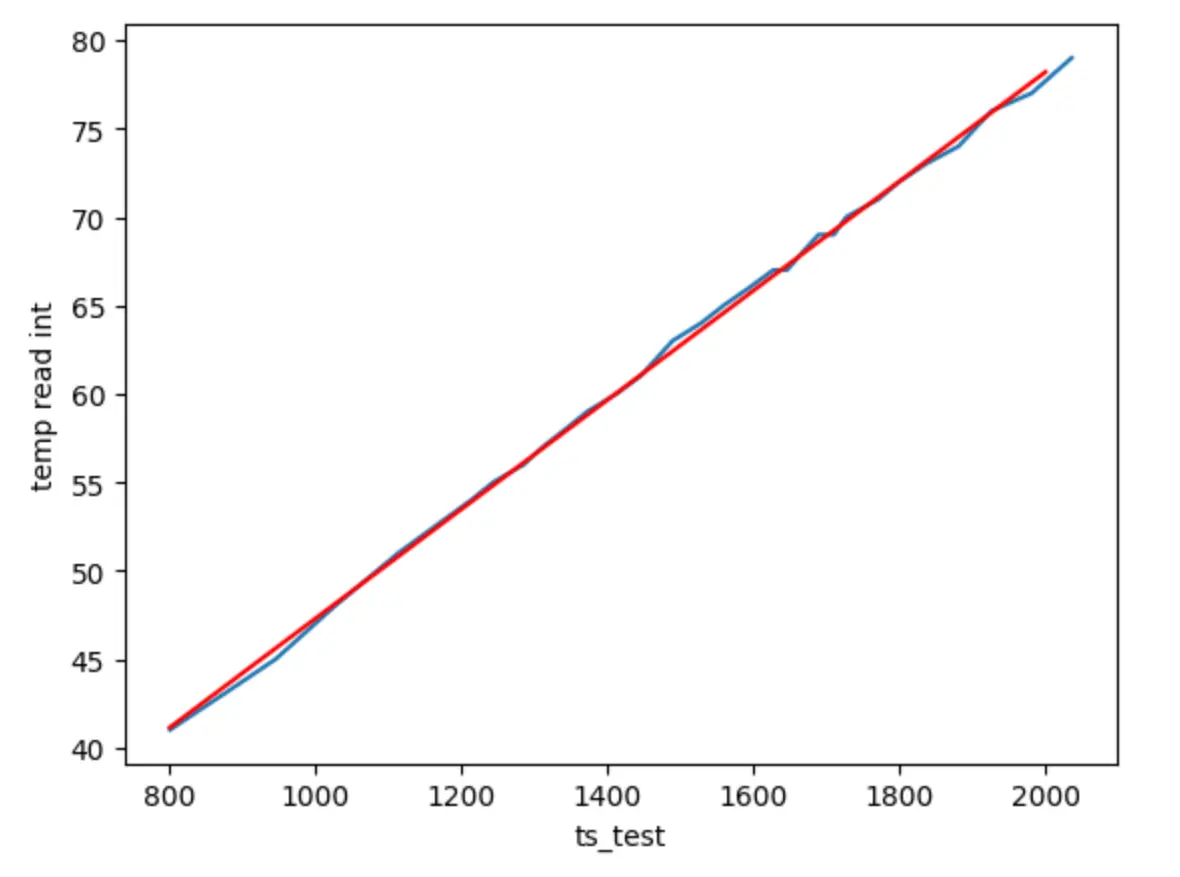
Slope is 0.03089 degres/second. This gives me the time needed to heat this specific volume of water (20L in my test) an additional 1°C: around 30 seconds of constant heating with full power.
For the heat loss, my goal was to know how much the water cools down during the period we need to wait for the probe reading to be accurate. Making a small heating test with a small volume of water to be able to put the external fast thermometer next to the probe, I measured the average lag of the probe to be around 1 minute! Of course.
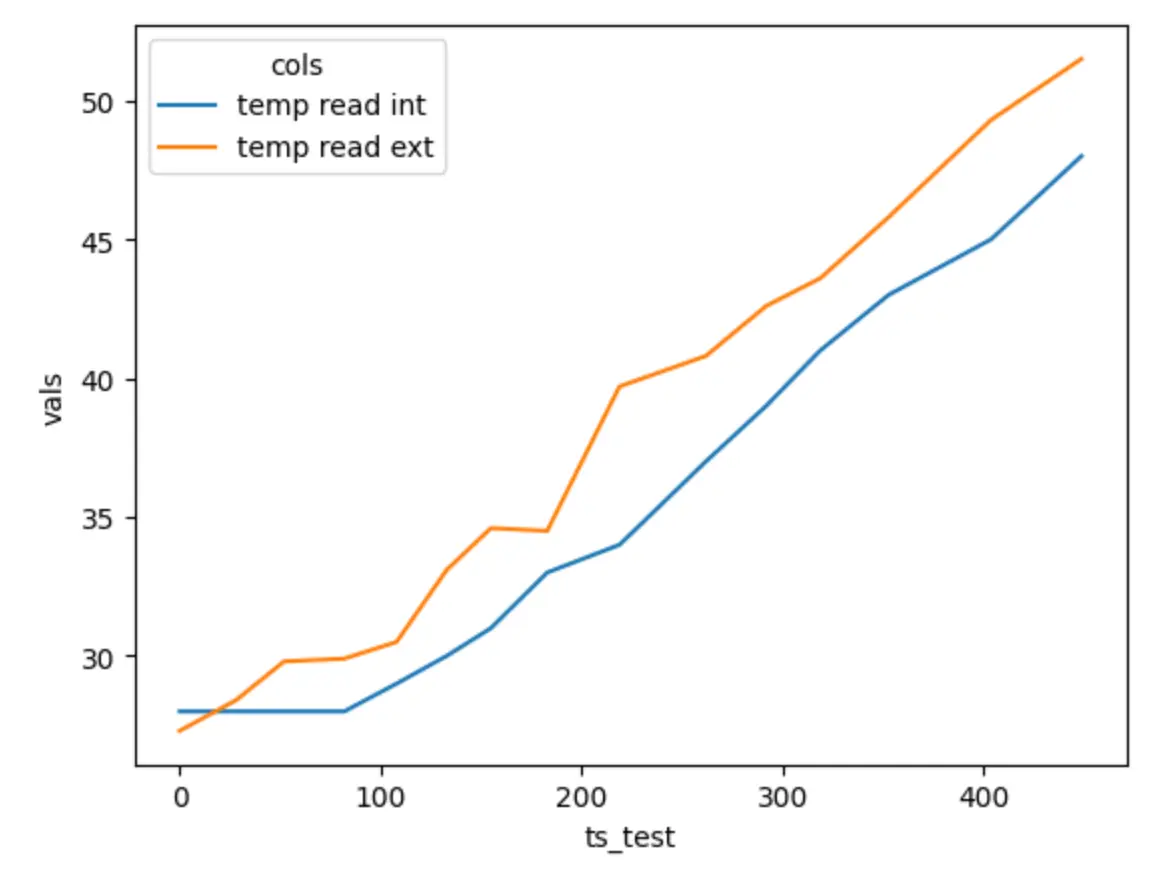
Same measurement but one thermometer is lagging hard!
During this time, and around the typical mashing temperatures, we see that the water cools down around 0.4°C
Here is the complete slope of the cooling plot in function of the temperature:
Slope measured depending on temperature during cooling.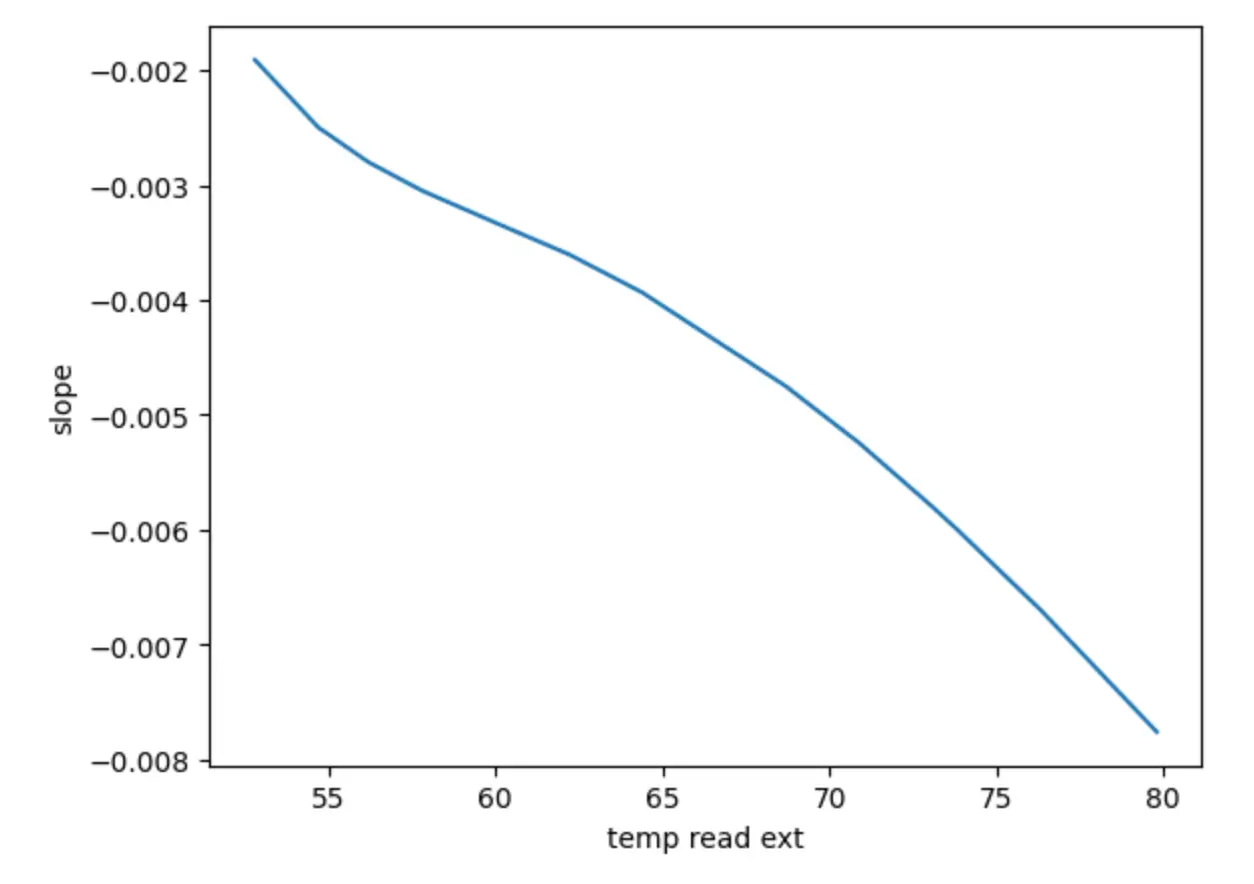
I may have overdone this, especially since I plan to use only constants values in the controller. But I am happy to have at least order of magnitude for heating duration needed, probe lagging, and cooling.
Later I will probably try to improve the temperature controller by allowing it to adapt to a wider range of volumes, but for now, I just plan to brew some batches, testing it in the field to get a good grasp of what to actually improve, if needed.
Controller design
Hardware
My plan use a 3d printed box containing an arduino, an lcd screen and several controls:
- a rotary encoder to select target temperature or setting value. Rotary encoder as also a push button so I could use it to validate selected choice or enter settings mode using long press.
- a switch to select manual or auto mode. I wanted to be able to turn on and of heating elements manually.
- a switch to select between mash mode and boil mode. During mash process, you want to set the water at a specific temperature, usually around 65-70°C, but there is also a boil step in brewing, and just activating it with a switch instead of manually setting the target temperature to 100°C feels like a nice to have feature.
- a switch to turn the heating element 1 on / off.
- a switch to turn the heating element 2 on / off.
- a switch to select between a simple display mode and a more complete one. The screen I got is very tiny, and I do not want it to display to small font, so I want a simple mode that will display only essential information. But I still want to be able to read detailed voltages and status in order to debug the code.
The process took some time, I had to battle with the rotary encoder a little bit, and also, I had to redo 15 bazillions times the crimping of the switch wires. It was my first time using JST connectors, and the female metal connector kept cutting my wires after crimping, or making it so fragile it broke after few hours. I guess my crimping plier was not the right one, but honestly I am not sure what happened.
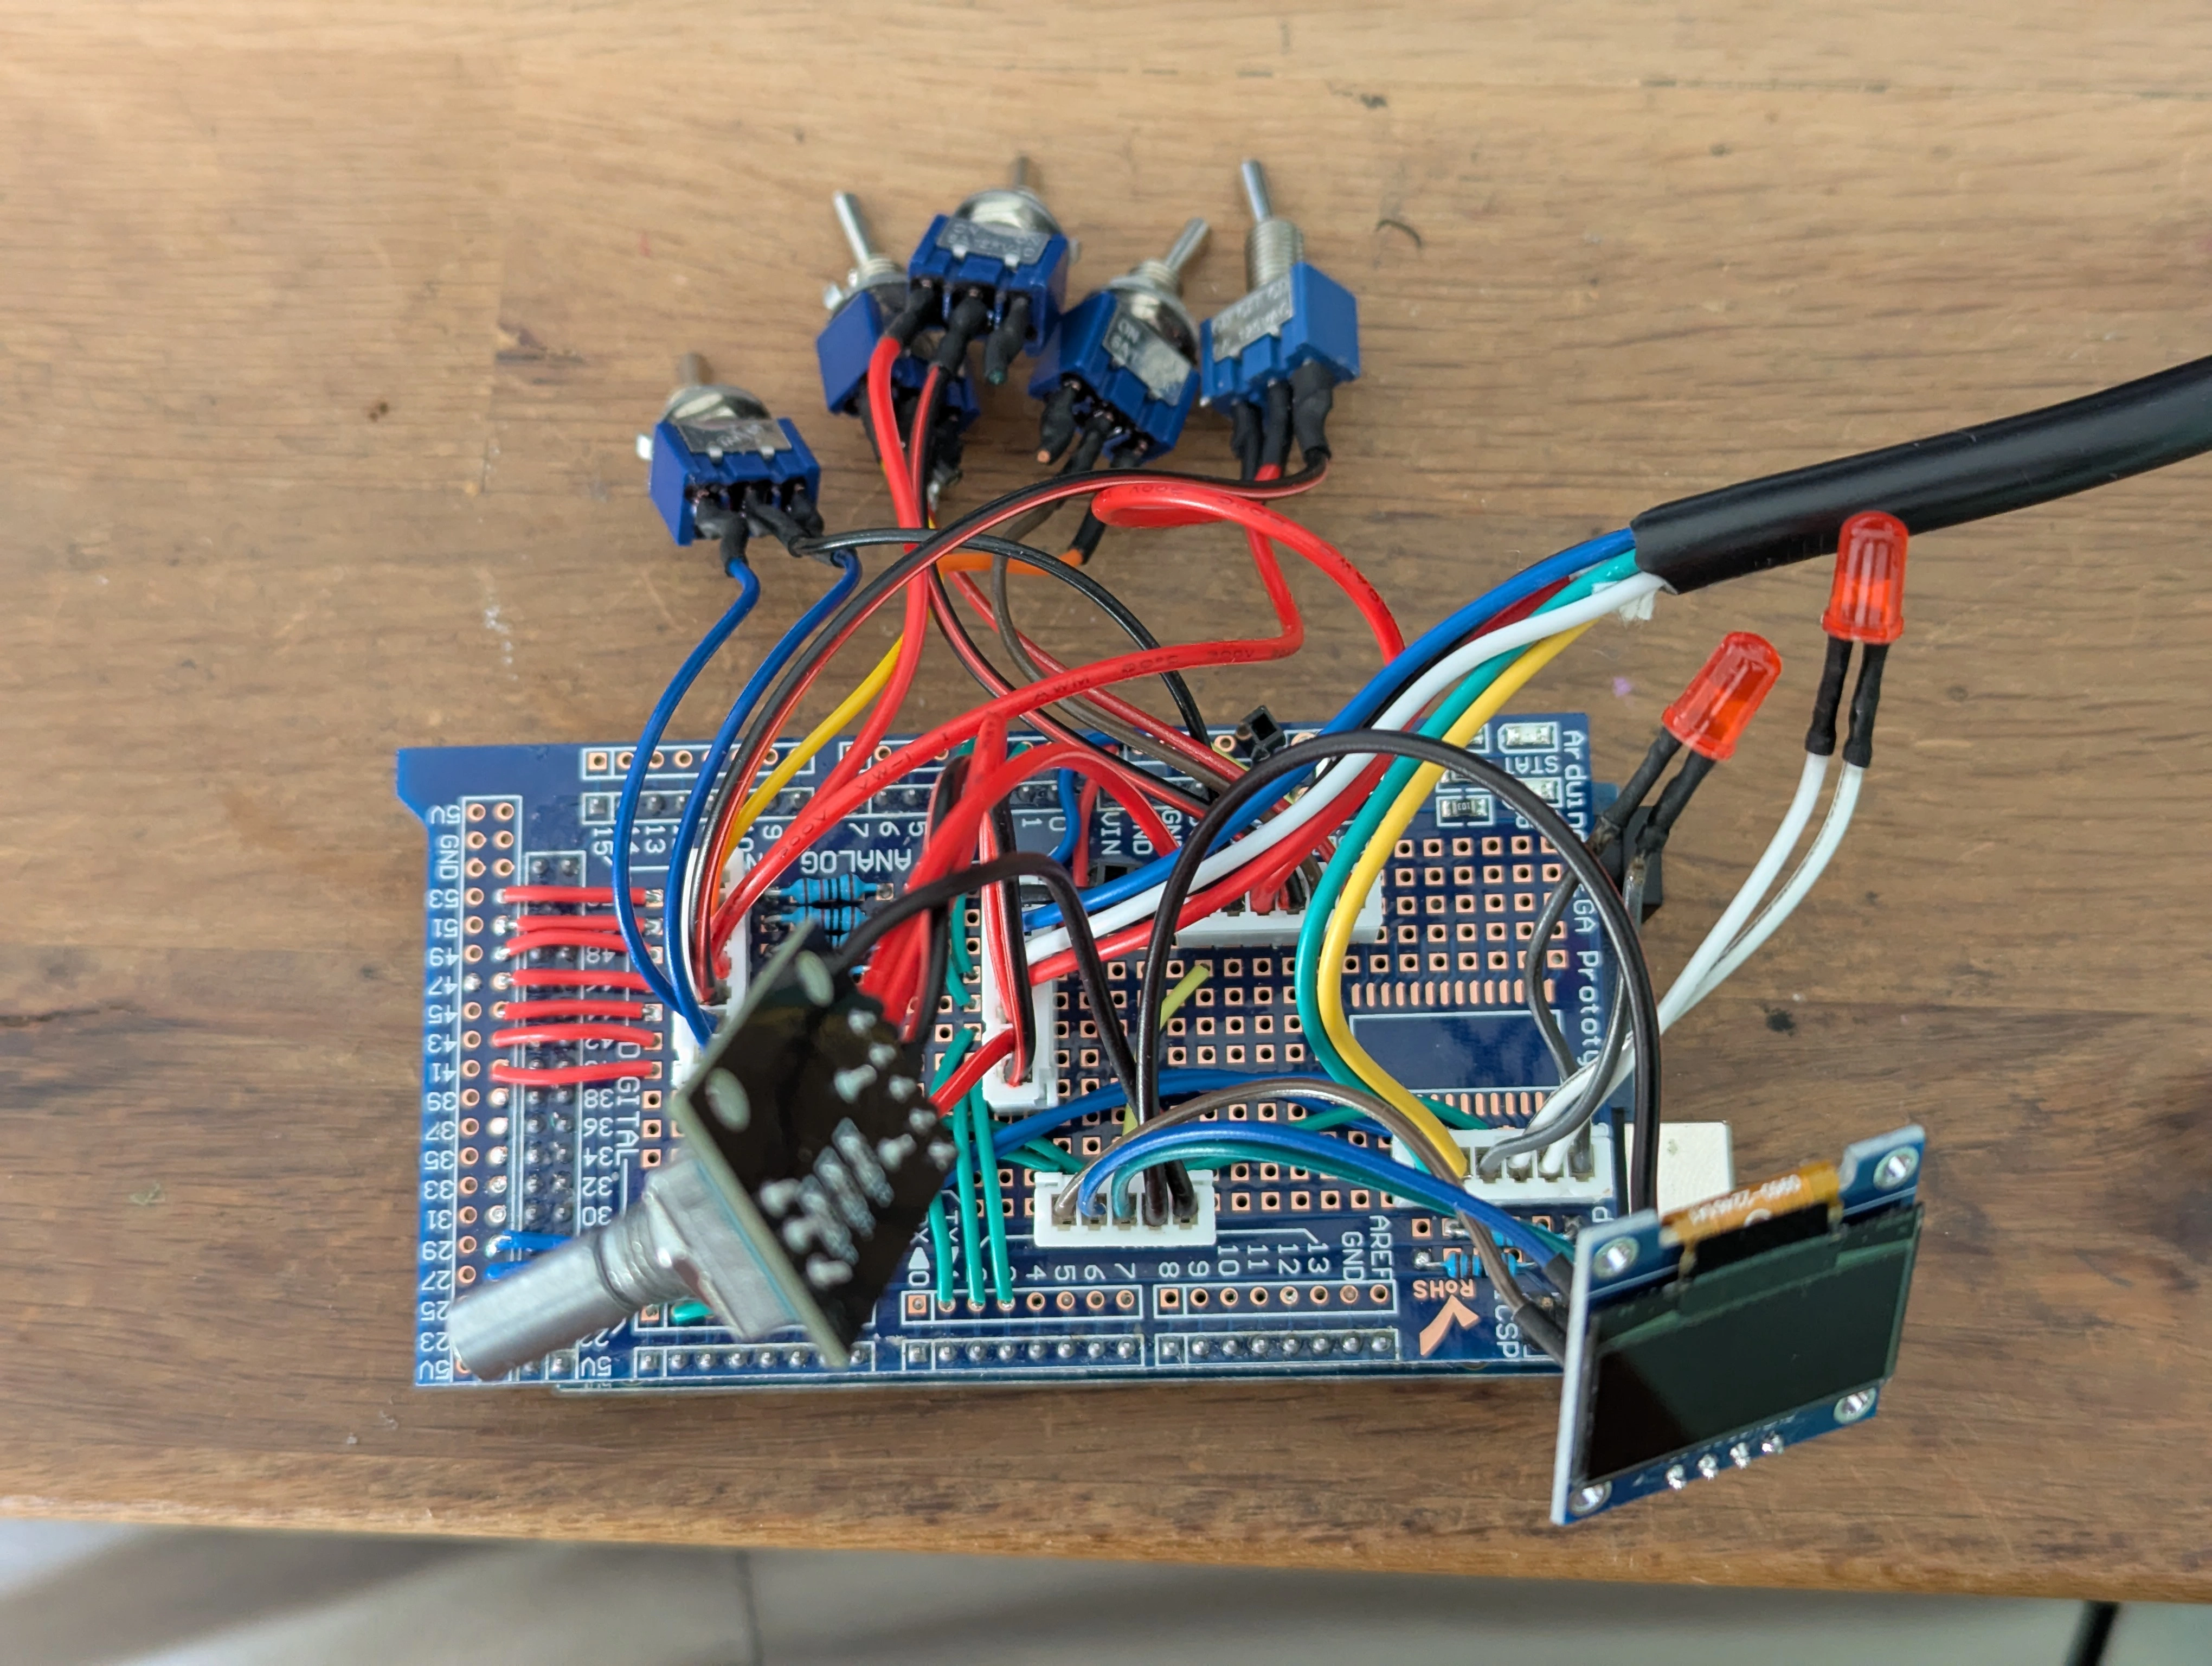
Coming together
I 3d printed a custom box (twice, as half the holes where misplaced in the first iteration).
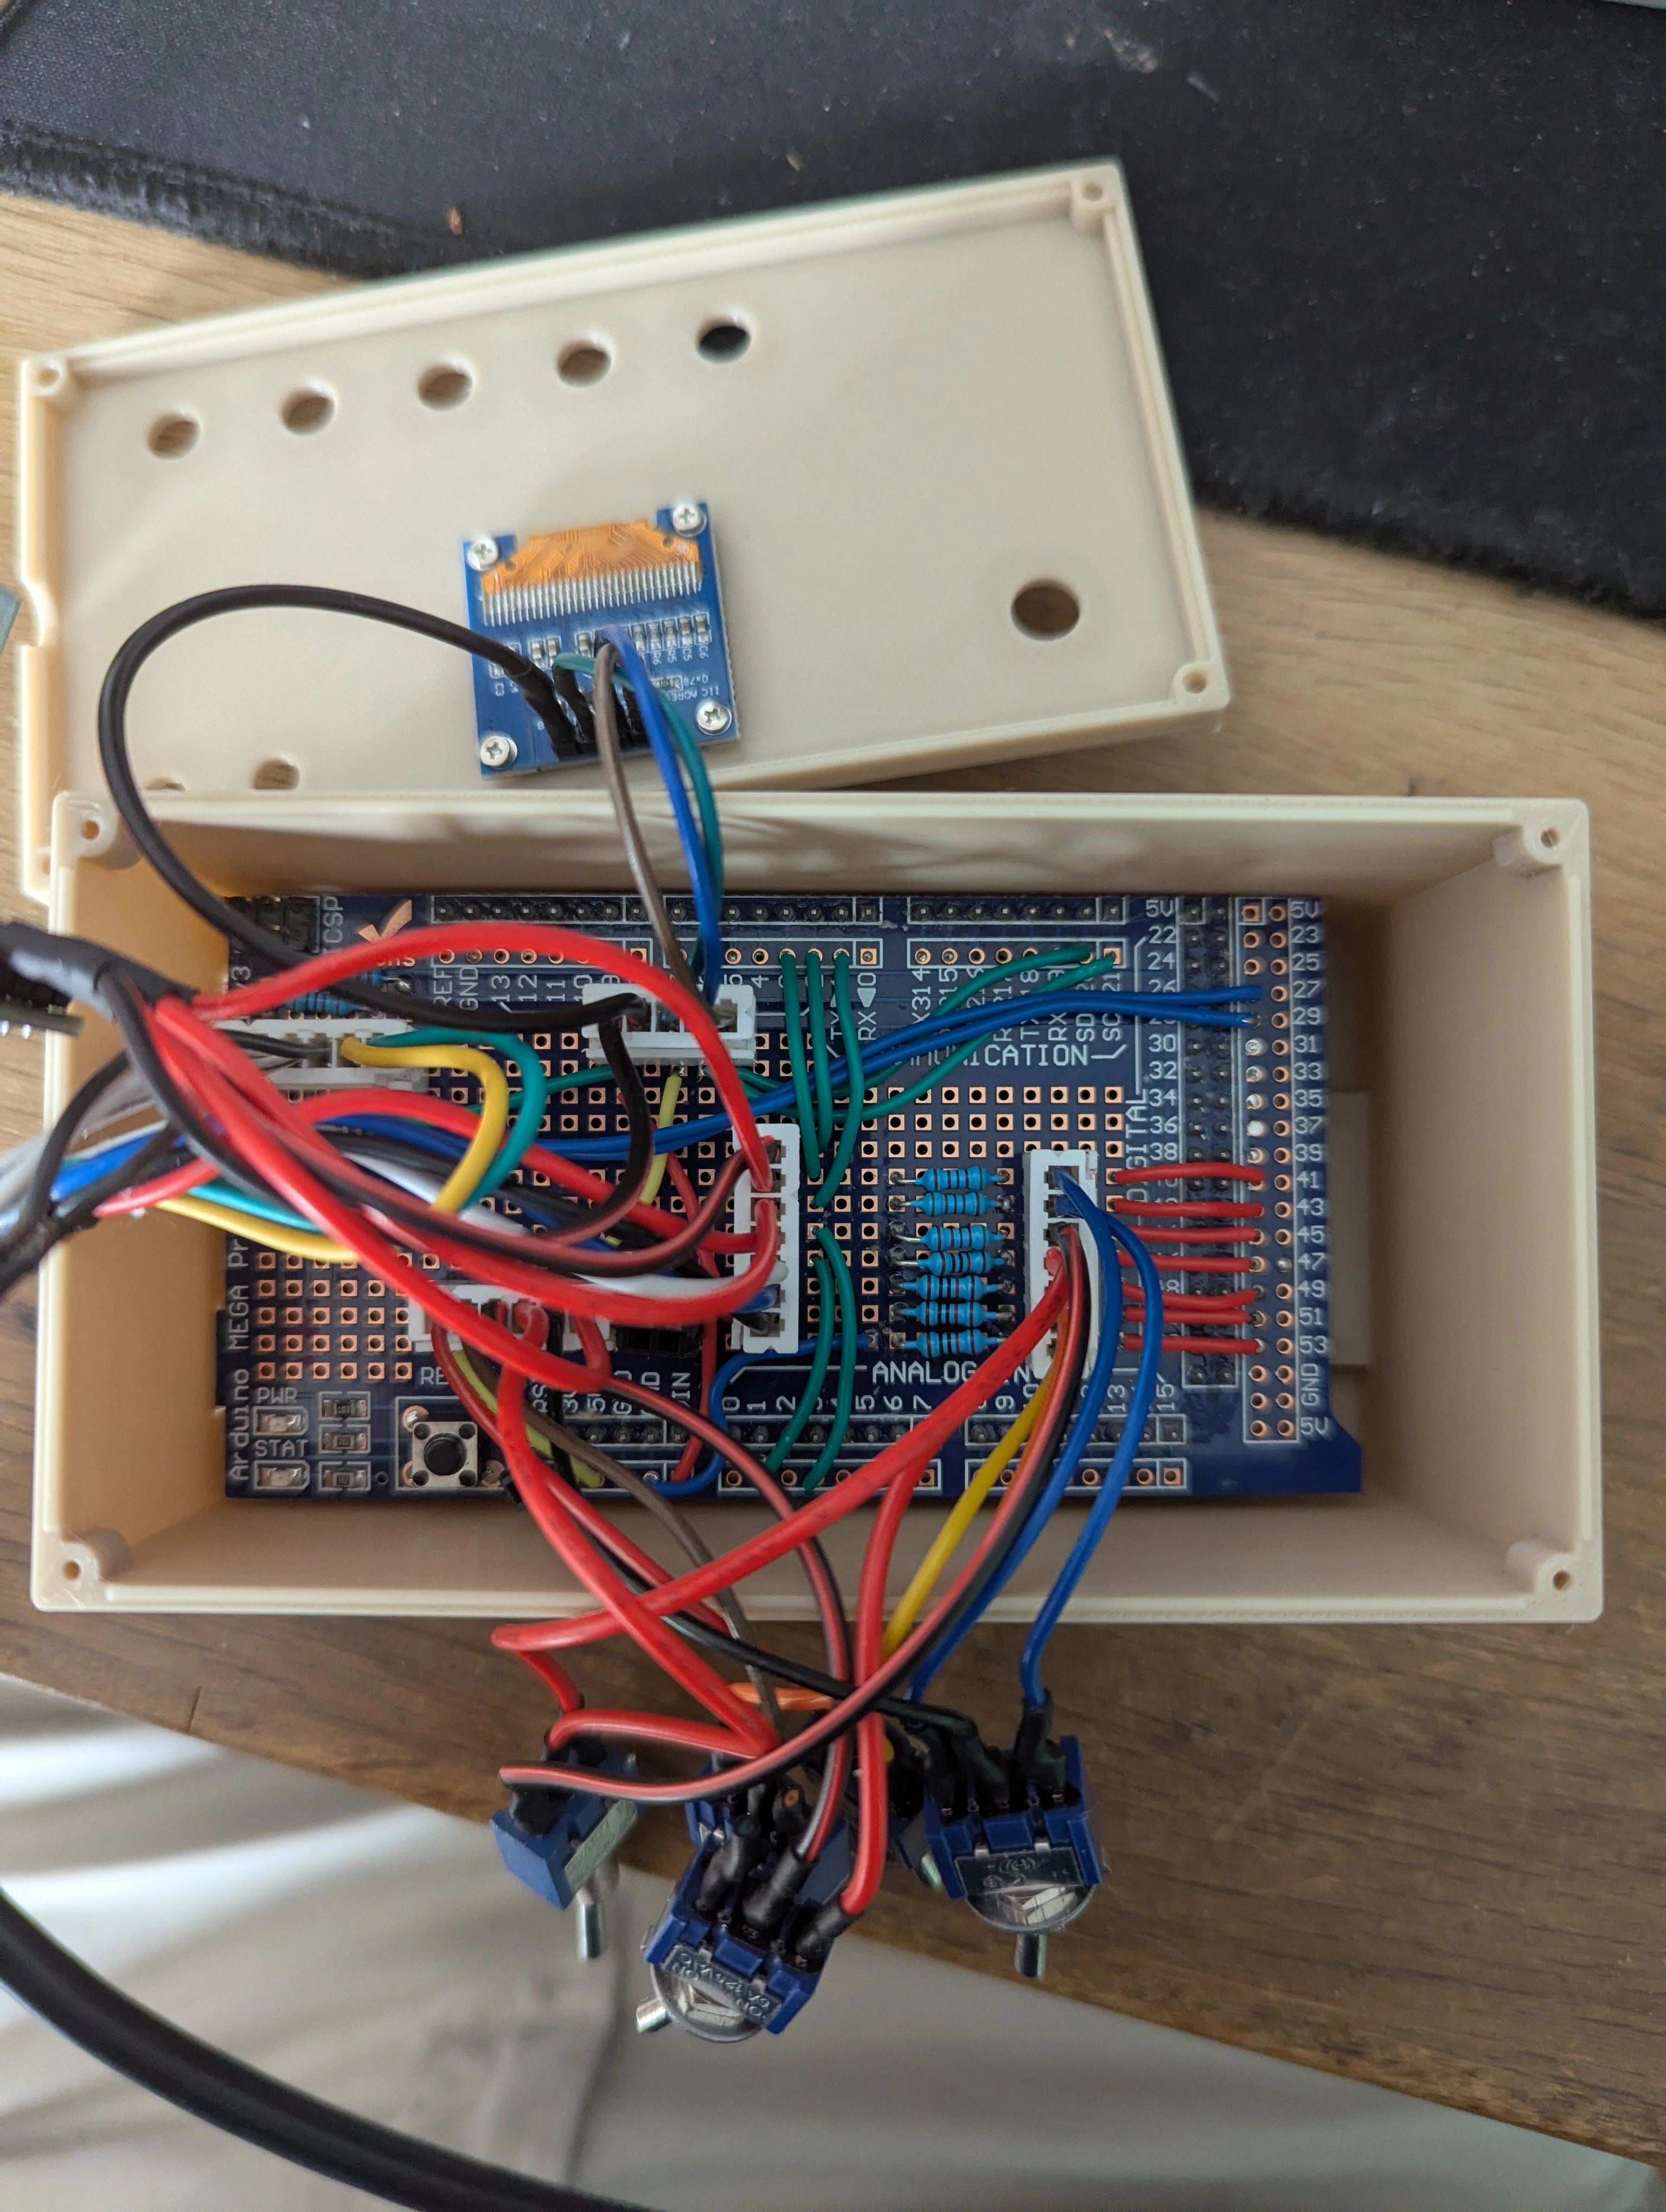
“What’s in the box!?”
And after closing it, seeing it’s not working properly, reopening it, fixing, reclosing it, approximately 8 times, I have finally something that should work. On the picture below you can see that the temperature displayed is 102, but this was before calibrating everything, and making the temperatures measurements I described in the previous section. It’s an hard coded value for now.
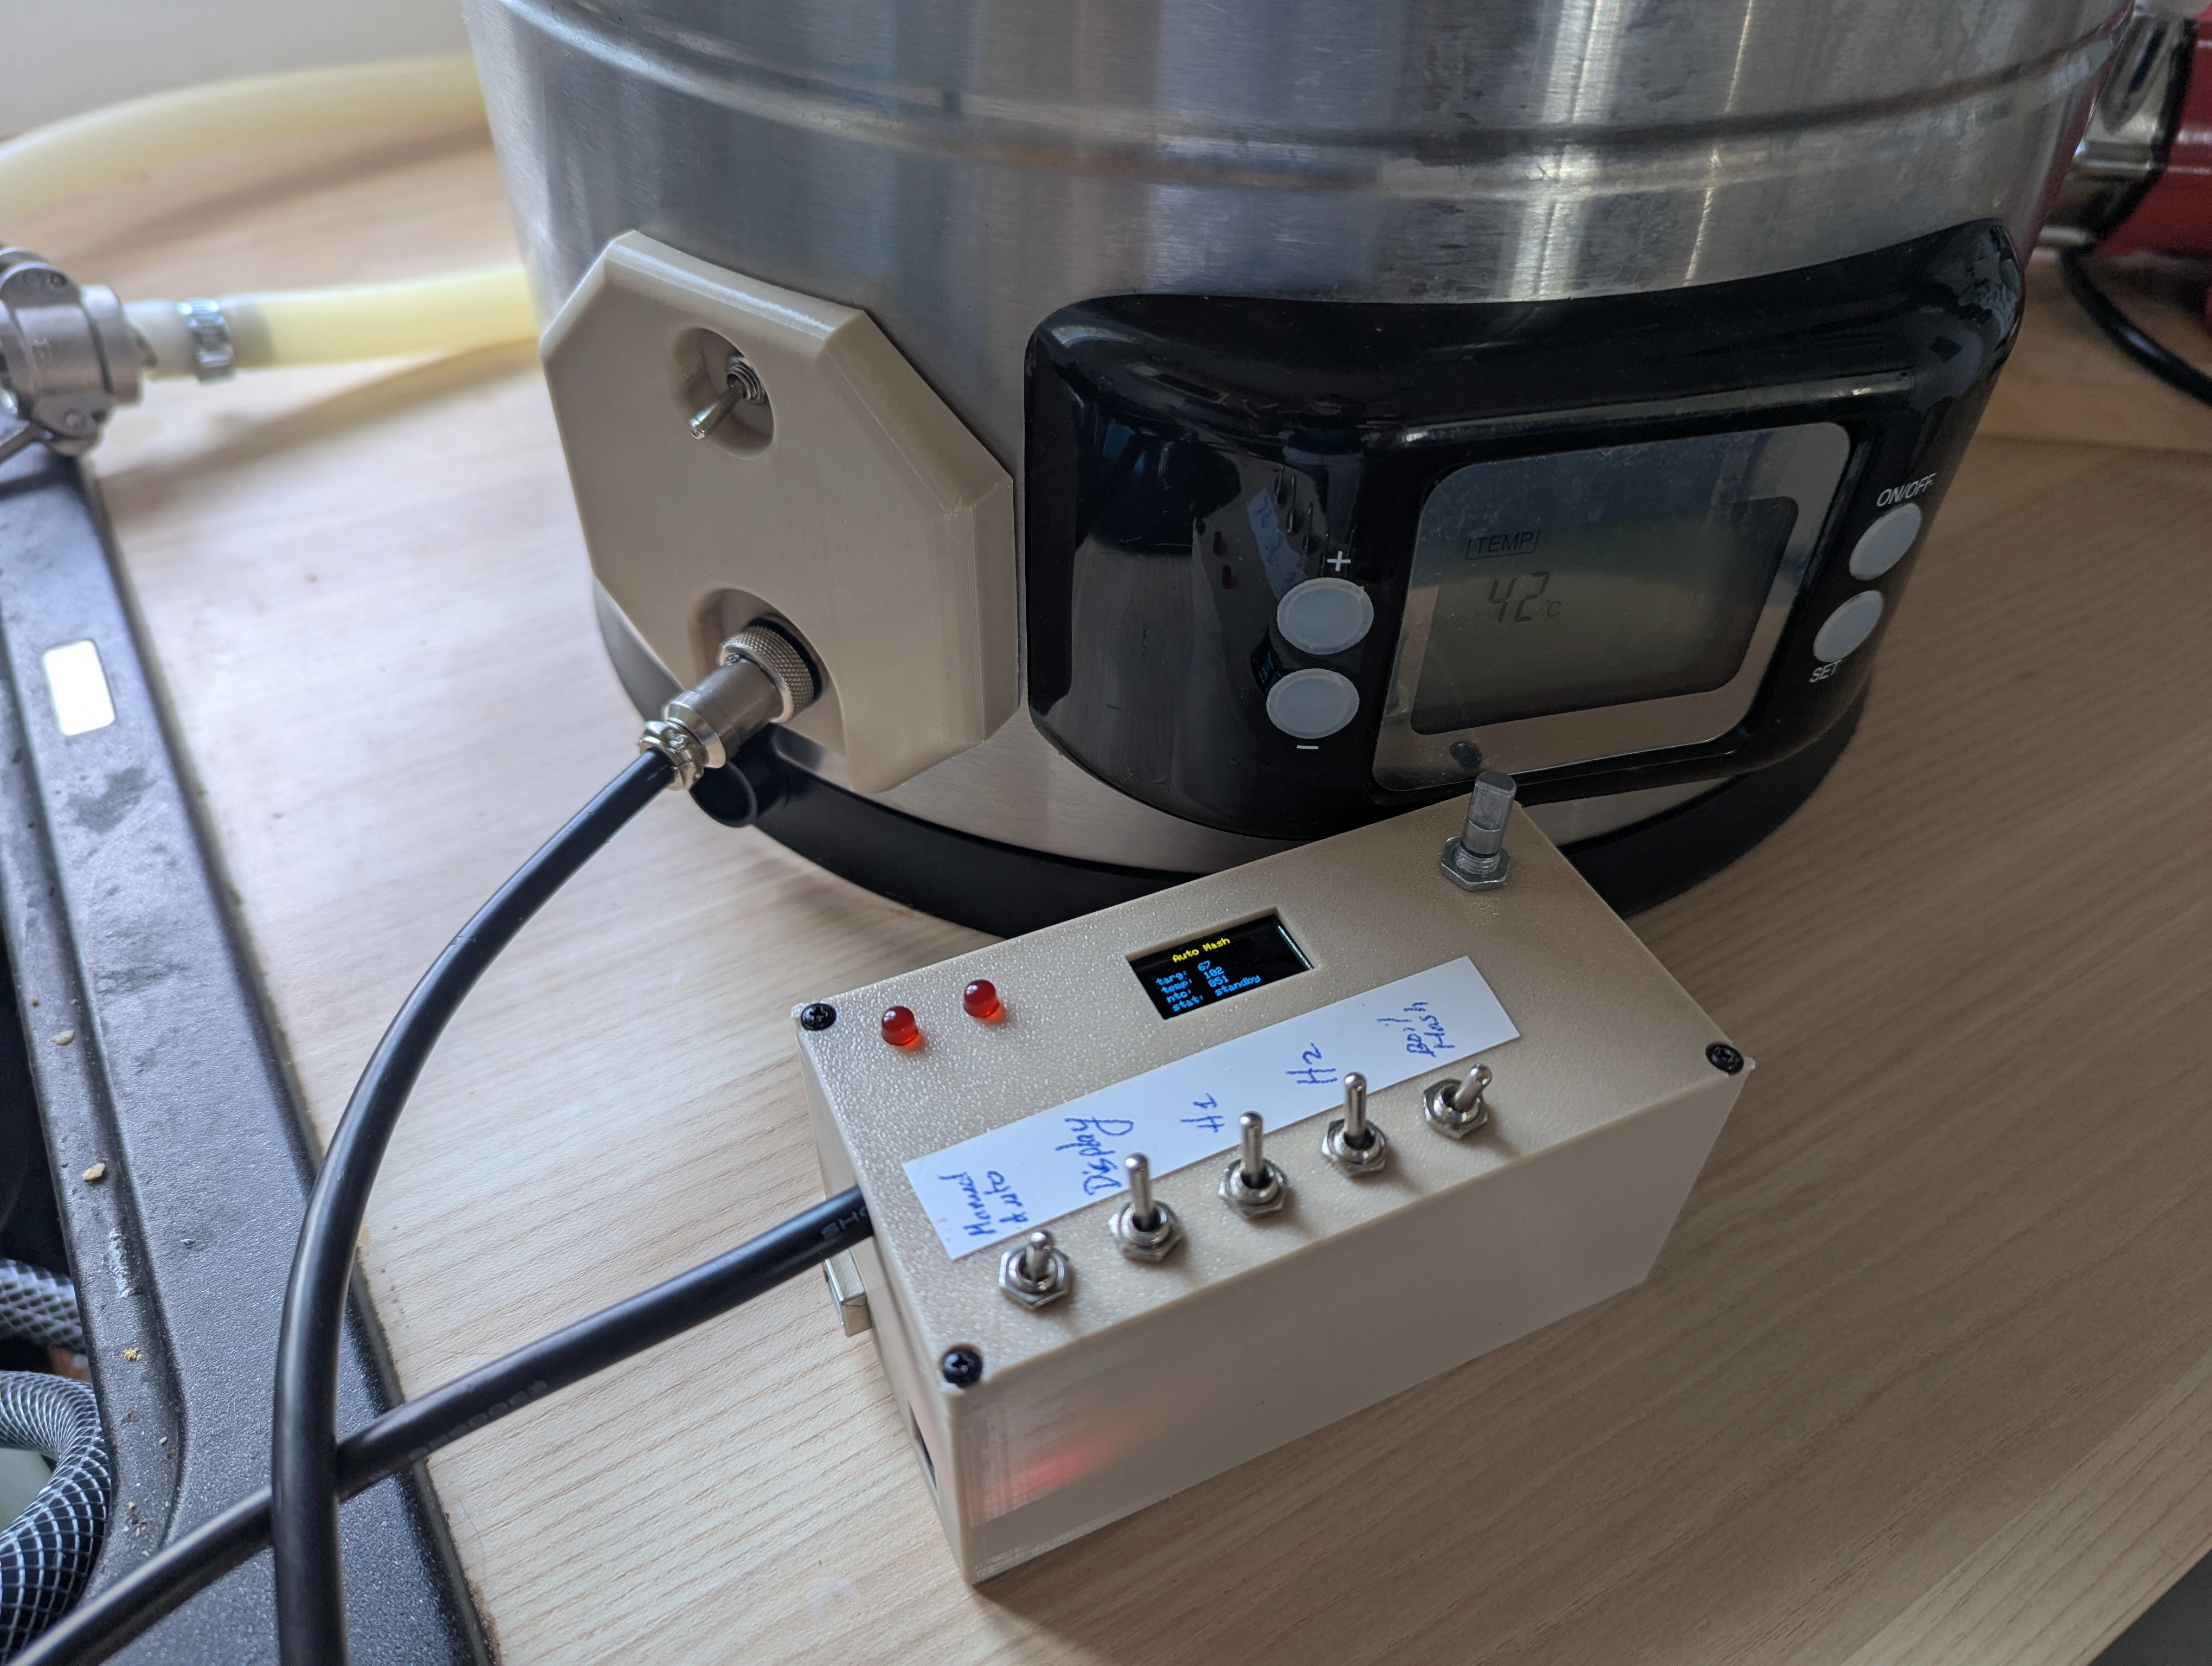
Hopefully, no more opening of the box
Software
Here I want to talk about my strategy for the mash mode. The rest of the code is pretty straightforward: input pin readings, mode selection, display. I used a specific library for the rotary encoder though, as the display library took a significant amount of processing and I was missing some pulses when just looking at clocks and data pins every loops. I first tried to do the interrupts mysefl but figured I could use a nice library instead of reinventing the wheel.
For the mash mode, the goal was to maintain the temperature as constant as possible around the target. There is 2 challenges though:
- the thermometer probe has a big inertia, or lag. As explained in the previous section, I measured a lag of around 60 seconds for the probe reading to be accurate.
- the water volume is quite big (around 20L), and the heating elements are only on the bottom: the temperature difference between the bottom and the top can be important.
My idea was to use the order of magnitude for heating duration, lag and cooling I got during testing in addition to the temperature readings, to make sensible adjustements. If I know that, in order to heat the water 1°C more, I needed to turn the heating elements for ~1 min for example, then I know that when the temperature read is 1°C less than target, I should not heat the water continuously for 5 min, even if probe is saying otherwise.
The plan was:
- when reading is above target, cut the heat!
- when far enough below the target, heat with no fear.
- when reaching a temp too close to the target, Stop. Wait for the probe reading to stabilize. Then heat for a fixed short time. Stop. Wait for the probe to stabilize, and so on.
This is what I implemented, using the values calculated during my test phase. For now, the mash mode works like this when probe reading is less than 10°C under the target:
- heat the water for the time needed to heat the water so it heats up 80% of the difference between actual temp and target.
- wait for 1 minute for the probe reading to stabilize.
- start over.
Pretty basic, but for know I have no idea if it is sufficient or not. Let’s brew so beer with those values, I will come back later if needed.
What could be done though?
- Using only one of the 2 heating elements when close to the target temp to get a gentle approach instead of turning everything on everytime. I did not performed those temperature recordings yet though.
- Using a model to compute the heating times instead of hardcoded values so that I could provide the water volume in the settings to adapt the controller. This feels like it should be done, but honeslty, I’ve never done less beer than maximum volume allowed by my tank, so I don’t see the point yet.
-
The zero pin voltage felt weird to me as I was expecting more of a 0V or 5V value. I worried that the Arduino would not reliably read the pin as LOW at 3V. I looked at it in more details: the pin is connected to the VCC5 through a 10K Omhs resistor, and to the GND pin through the output of an optocoupler. The optocoupler is controlled directly by the AC power voltage (disconnected when the safety switch trips, and connected to the 240V AC in normal operating condition.) The weird low voltage may be because of the alternative current driving the optocoupler, and thus making it pulsing. That could explain the 3V measurement on a simple multimeter. I do not have an oscilloscope to check though. In the end, I connected the zero voltage to an analog pin, and I saw there that the pin as indeed oscillating between LOW and HIGH. I figured that if the pin stays HIGH long enough, I can trigger the error. ↩︎
-
Is the mash actually the same heat capacity as water? The grain present in the water represents a big portion of the mass, I’m not sure about the implications. ↩︎